Wednesday, September 30, 2009

Cassini Reveals New Ring Quirks, Shadows During Saturn Equinox

0 comments
view of Saturn's rings during equinox
NASA scientists are marveling over the extent of ruffles and dust clouds revealed in the rings of Saturn during the planet's equinox last month. Scientists once thought the rings were almost completely flat, but new images reveal the heights of some newly discovered bumps in the rings are as high as the Rocky Mountains. NASA released the images Monday.

"It's like putting on 3-D glasses and seeing the third dimension for the first time," said Bob Pappalardo, Cassini project scientist at NASA's Jet Propulsion Laboratory in Pasadena, Calif. "This is among the most important events Cassini has shown us."

On Aug. 11, sunlight hit Saturn's rings exactly edge-on, performing a celestial magic trick that made them all but disappear. The spectacle occurs twice during each orbit Saturn makes around the sun, which takes approximately 10,759 Earth days, or about 29.7 Earth years. Earth experiences a similar equinox phenomenon twice a year; the autumnal equinox will occur Sept. 22, when the sun will shine directly over Earth's equator.

For about a week, scientists used the Cassini orbiter to look at puffy parts of Saturn's rings caught in white glare from the low-angle lighting. Scientists have known about vertical clumps sticking out of the rings in a handful of places, but they could not directly measure the height and breadth of the undulations and ridges until Saturn's equinox revealed their shadows.

"The biggest surprise was to see so many places of vertical relief above and below the otherwise paper-thin rings," said Linda Spilker, deputy project scientist at JPL. "To understand what we are seeing will take more time, but the images and data will help develop a more complete understanding of how old the rings might be and how they are evolving."

The chunks of ice that make up the main rings spread out 140,000 kilometers (85,000 miles) from the center of Saturn, but they had been thought to be only around 10 meters (30 feet) thick in the main rings, known as A, B, C, and D.

In the new images, particles seemed to pile up in vertical formations in each of the rings. Rippling corrugations -- previously seen by Cassini to extend approximately 804 kilometers (500 miles) in the innermost D ring -- appear to undulate out to a total of 17,000 kilometers (11,000 miles) through the neighboring C ring to the B ring.

The heights of some of the newly discovered bumps are comparable to the elevations of the Rocky Mountains. One ridge of icy ring particles, whipped up by the gravitational pull of Saturn's moon Daphnis as it travels through the plane of the rings, looms as high as about 4 kilometers (2.5 miles). It is the tallest vertical wall seen within the rings.

"We thought the plane of the rings was no taller than two stories of a modern-day building and instead we've come across walls more than 2 miles [3 kilometers] high," said Carolyn Porco, Cassini imaging team leader at the Space Science Institute in Boulder, Colo. "Isn't that the most outrageous thing you could imagine? It truly is like something out of science fiction."

Scientists also were intrigued by bright streaks in two different rings that appear to be clouds of dust kicked up in collisions between small space debris and ring particles. Understanding the rate and locations of impacts will help build better models of contamination and erosion in the rings and refine estimates of their age. The collision clouds were easier to see under the low-lighting conditions of equinox than under normal lighting conditions.

At the same time Cassini was snapping visible-light photographs of Saturn's rings, the Composite Infrared Spectrometer instrument was taking the rings' temperatures. During equinox, the rings cooled to the lowest temperature ever recorded. The A ring dropped down to a frosty 43 Kelvin (382 degrees below zero Fahrenheit). Studying ring temperatures at equinox will help scientists better understand the sizes and other characteristics of the ring particles.

The Cassini spacecraft has been observing Saturn, its moons and rings since it entered the planet's orbit in 2004. The spacecraft's instruments have discovered new rings and moons and have improved our understanding of Saturn's ring system.

The Cassini-Huygens mission is a cooperative project of NASA and the European and Italian Space Agencies. JPL manages the mission for the Science Mission Directorate at NASA Headquarters in Washington. JPL also designed, developed and assembled the Cassini orbiter and its two onboard cameras. The imaging team is based at the Space Science Institute. The Composite Infrared Spectrometer team is based at NASA's Goddard Space Flight Center in Greenbelt, Md.

To view Cassini images of the equinox and for more information about the mission, visit http://www.nasa.gov/cassini .

NASA Television's Video File also will air the images and interview sound bites. For downlink, scheduling information and streaming video, visit http://www.nasa.gov/ntv .

Tuesday, September 29, 2009

Snapshots From Space Cultivate Fans Among Midwest Farmers

0 comments
On September 10, 2009, Landsat scanned this image of farmland across northwest Minn., including a view of Noreen Thomas' organic farm on the banks of the Buffalo River near the middle of the imageNoreen Thomas’ farm looks like a patchwork quilt. Fields change hue with the season and with the alternating plots of organic wheat, soybeans, corn, alfalfa, flax, or hay.

Thomas enjoys this view from hundreds of miles above Earth’s surface -- not just for the beauty, but the utility. She is among a growing group of Midwest farmers who rely on satellite imagery from Landsat to maximize their harvest and minimize damage to their fields. It's become another crucial tool like their tractors and sprinklers.

“Our farm is unconventional – we grow food and breed animals using all-natural approaches,” said Thomas of her certified organic farm in Moorhead, Minnesota, where they also grow heirloom tomatoes, lettuce, squash, and peas. “So we’re happy to use unconventional methods to solve problems and keep our crops healthy.”

For $25 and an hour’s drive to the Grand Forks campus of the University of North Dakota (UND), Noreen and Lee Thomas took a one-day class on how to download and interpret satellite images, like those provided by NASA and the U.S. Geological Survey (USGS).

Farmers in the upper Midwest use false-color, left, Landsat images like this one captured over Grand Forks, N.D. August 30, 2005 to evaluate the health of their fields. The image on the right shows the same land area in true color as the natural eye would see.
> View larger image
Like Noreen Thomas, hundreds of farmers in the upper Midwest use false-color (left) Landsat images like this one captured over Grand Forks, N.D. August 30, 2005 to evaluate the health of their fields. The image on the right shows the same land area in true color as the natural eye would see.

Downloading the latest images takes mere minutes on the Digital Northern Great Plains system, a free Web-based tool developed by NASA-funded researchers in the Upper Midwest Aerospace Consortium. Thomas punches in GPS coordinates of the area she’d like to see, and moments later she has a bumper crop of information and images.

To the untrained eye, the false-color images appear a hodge-podge of colors without any apparent purpose. But Thomas is now trained to see yellows where crops are infested, shades of red indicating crop health, black where flooding occurs, and brown where unwanted pesticides land on her chemical-free crops.

The images help the Thomases root out problems caused by Canadian thistle and other weeds. They help confirm that their crops are growing at least 10 feet from the borders of a neighboring farm – required to maintain organic certification. They can also spot the telltale signs of bottlenecking in the fields -- where flooding is over-saturating crops -- and monitor the impact of hail storms.

“We’d have to walk our entire 1,200 hundred-plus acres on a regular basis to see the same things we can see by just downloading satellite images,” said Thomas, who recently began providing her farm’s coordinates to her buyers in Japan. “There’s no more ideal way I know to show how healthy our crops are to someone thousands of miles away.”

Organic farmer Noreen Thomas talks to school students on her farmCrops are not the only beneficiaries of snapshots from space. Just as remote imagery informs Thomas when it’s best to rotate crops, she can also determine when her cows need a new pasture. When the large herd of cows chews its way through the landscape, satellite images show where the cows may be overgrazing.

Though Thomas believes she is the lone satellite ranger in her town, she’s certainly not alone among farmers in general. According to George Seielstad, recently retired director of the UND Center for People and the Environment and founder of the consortium, more than 600 farmers in the region are now devotees of satellite data as an aid to farming.

Thomas has also become a resource to her community because of her unique ability to analyze satellite images. “We’ve been called by a couple of townships to pull satellite images to verify flooding so they can apply for aid from the Federal Emergency Management Agency," she said. "There are any number of ways these pictures have been helping farming communities like ours, and community is what farming is built on.”

Related Links:

> UMAC’s Digital Northern Great Plains System
> Landsat at NASA
> Landsat at USGS
> UMAC’s Agriculture Public Access Resource Center

Wednesday, September 23, 2009

NASA Satellite Data Show Progress of 2009 Antarctic Ozone Hole

0 comments
Ozone hole as shown by Sept. 10, 2009, satellite data

The annual ozone hole has started developing over the South Pole, and it appears that it will be comparable to ozone depletions over the past decade. This composite image from September 10 depicts ozone concentrations in Dobson units, with purple and blues depicting severe deficits of ozone.

"We have observed the ozone hole again in 2009, and it appears to be pretty average so far," said ozone researcher Paul Newman of NASA's Goddard Space Flight Center in Greenbelt, Md. "However, we won't know for another four weeks how this year's ozone hole will fully develop."

September 16 marks the International Day for the Protection of the Ozone Layer, declared by the United Nations to commemorate the date when the Montreal Protocol was signed to ban use of ozone depleting chemicals such as chlorofluorocarbons (CFCs).

Scientists are tracking the size and depth of the ozone hole with observations from the Ozone Monitoring Instrument on NASA's Aura spacecraft, the Global Ozone Monitoring Experiment on the European Space Agency's ERS-2 spacecraft, and the Solar Backscatter Ultraviolet instrument on the National Oceanic and Atmospheric Administration's NOAA-16 satellite.

The depth and area of the ozone hole are governed by the amount of chlorine and bromine in the Antarctic stratosphere. Over the southern winter, polar stratospheric clouds (PSCs) form in the extreme cold of the atmosphere, and chlorine gases react on the cloud particles to release chlorine into a form that can easily destroy ozone. When the sun rises in August after months of seasonal polar darkness, the sunlight heats the clouds and catalyzes the chemical reactions that deplete the ozone layer. The ozone hole begins to grow in August and reaches its largest area in late September to early October.

Recent observations and several studies have shown that the size of the annual ozone hole has stabilized and the level of ozone-depleting substances has decreased by 4 percent since 2001. But since chlorine and bromine compounds have long lifetimes in the atmosphere, a recovery of atmospheric ozone is not likely to be noticeable until 2020 or later.

Visit NASA's Ozone Watch page for current imagery and data: http://ozonewatch.gsfc.nasa.gov/index.html

Related Links:

› Ozone Day 2009
› Antarctic Ozone Hole: 1979 to 2008
› Climate Change and Atmospheric Circulation Will Make for Uneven Ozone Recovery
› New Simulation Shows Consequences of a World Without Earth's Natural Sunscreen
› What's Holding Antarctic Sea Ice Back From Melting?
› Ozone Hole Multimedia

Tuesday, September 22, 2009

St. Louis Cardinals Honor Sandra Magnus and Celebrate NASA

0 comments
Astronaut Sandra H. Magnus, mission specialist/ISS flight engineerIn late August, the St. Louis Cardinals took NASA Astronaut Sandra Magnus to the ball game to throw out the first pitch. Magnus isn’t part of the Cardinals’ starting line-up, but she is a hometown hero.

Magnus’ roots were planted in nearby Belleville, Ill. Her homecoming was part of NASA’s Hometown Heroes campaign, which aims to engage and excite the public about NASA’s space exploration missions, celebrate both the advent of a six-person crew on the nearly complete International Space Station and the 40th anniversary of Apollo 11.

This was Magnus’ first time back to St. Louis since her four-and-a-half month stay aboard the station as part of the Expedition 18 crew in March. Her first flight was on STS-112 in 2002. Magnus earned a bachelor’s degree in physics, a master’s in electrical engineering from the Missouri University of Science and Technology and a doctorate in materials science and engineering from Georgia Institute of Technology.

“I’m a little more nervous about this (throwing the first pitch) than flying in space because I haven’t practiced as much… I have to make it to home plate,” Magnus said.

And she did make it to home plate to kick-off the sold-out Cardinals game against the Houston Astros, the city where Magnus now lives as part of NASA’s Astronaut Corps at Johnson Space Center. The Cardinals won that night.

The self-proclaimed Cardinals fan was also on a mission to inspire the next generation of explorers in her hometown. Magnus spoke to hundreds of students, including the Missouri Boy Scout troops, about her space adventures and her love for math and science.

At the St. Louis Science Center, hundreds of students laid on their backs to look up at the planetarium’s ceiling that was illuminated with videos of Magnus’ mission, from launch to landing, and listen to Magnus tell her stories. Afterwards, Magnus answered various questions, signed autographs and connected with students.

“It was my first time seeing an astronaut,” said Laci Jo, a six-year-old from Moberly, Mo., whose current ambitions include artist, teacher, and now—astronaut. It was great to see the movie. My favorite part was watching her do back flips (aboard the station).”

“She’s always been interested in space,” said Charli Wheeler, Laci Jo’s mother. “But this is a female (astronaut). It shows her what women can do. We live in a small town where there’s still stereotypes that woman can’t do everything.”

St. Louis is known for the Gateway Arch, which provided early American pioneers into the West. But Magnus is making sure that’s she’s providing a gateway for the next explorers into a very different frontier – space.

“I’m a girl and I do math and science,” Magnus said. “I would encourage all students, boys and girls, to follow whatever dream they may have, and certainly don’t limit yourself. That’s the key – don’t limit yourself. Believe in yourself, and go for it.”

For more information about the NASA Hometown Heroes 2009 campaign, visit: http://www.nasa.gov/astronauts

Monday, September 21, 2009

The X-15, the Pilot and the Space Shuttle

0 comments
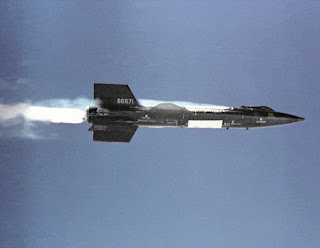
The X-15 research aircraft on its first powered flight on Sept. 17, 1959Fifty years ago in 1959, test pilot Scott Crossfield threw the switch to ignite the twin XLR-11 engines of his North American Aviation X-15 rocket plane and begin the storied test program's first powered flight.

It was a real kick in the pants.

"The drop from the B-52 carrier aircraft was pretty abrupt, and then when you lit that rocket a second or two later you definitely felt it,” said Joe Engle, another X-15 test pilot and member of the same exclusive fraternity of flyboys that included Crossfield and the eventual first man on the moon, Neil Armstrong. All took the X-15 to speeds and altitudes that extended the frontiers of flight.

The X-15 was a research scientist's dream. The experimental, rocket-boosted aircraft flew 199 flights with 12 different pilots at the controls from 1959 through 1968. It captured vital data on the effects of hypersonic flight on man and machine that proved invaluable to the nation's aeronautics researchers, including NASA and developers of the space shuttle.

"That first powered flight was a real milestone in a program that we still benefit from today," said Engle.

Engle knows what he’s talking about.

The Kansas native flew the X-15 for the U.S. Air Force 16 times from 1963 to 1965 and went on to command two missions of NASA's space shuttle.

Still an active pilot, the retired major general fondly recalled what it was like to fly the X-15 and how lessons learned then made possible the space shuttle program years later.

"It was a very busy airplane to fly, but it also was a beautiful airplane to fly; a very, very good solid flying vehicle. Particularly when you were subsonic, in the landing pattern— even at the lower supersonic speeds," Engle said.

Three times Engle flew an X-15 higher than 50 miles, officially qualifying him for Air Force astronaut wings and providing him a brief moment for sightseeing at the edge of space.

"I didn't really have time to soak up the view in the X-15 like I did later when I flew the space shuttle," Engle said.

"You could glance out and see the blackness of space above and the extremely bright Earth below. The horizon had the same bands of color you see from the shuttle, with black on top, then purple to deep indigo, then blues and whites.

"You were just so terribly busy flying the airplane, keeping everything under control and watching for any deviations. And in many cases, during re-entry flights for example, making sure the airplane was perfectly lined up as you started to enter the atmosphere."

Engle credits the X-15 for laying the foundation for many of the operational techniques of the space shuttle, and for providing designers with confidence that certain design and control concepts for the winged orbiter would work:
  • With similar flying characteristics, the X-15 proved the shuttle could re-enter the atmosphere and glide to a precision landing, in part relying on a maneuver known as Terminal Area Energy Management where speed and altitude are carefully controlled so the vehicle can reach the runway instead of falling short or overflying it.

  • Using technology developed and tested on the X-15, pilots learned how to transition control smoothly from reaction control jets at high altitudes or in space to wing- and tail-mounted control surfaces in the atmosphere closer to the ground.

  • While not a benefit to the space shuttle alone, the X-15 was the first flight test program to make extensive use of simulators to work out certain problems and train pilots before going up—a practice since employed for nearly every flight test program.

  • The X-15 flights proved the usefulness of having chase aircraft follow a test vehicle during its approach to the runway to make sure, as Engle put it: "Everything that is supposed to be up is up, and everything that is supposed to be down is down."
The X-15 was suggested in the early 1950s by Bell Aircraft's Walter Dornberger as a vehicle for exploring the realm of hypersonic flight, which was defined as a speed in excess of Mach 5, or five times the speed of sound. The earliest days of the X-15 program were shaped by the National Advisory Committee for Aeronautics, the federal agency which NASA replaced in 1958.

The NACA, Air Force and Navy all had an interest in the program and all provided resources, including pilots. Eventually the Navy stopped supporting the X-15 in order to concentrate on aircraft carrier operations, Engle said.

By the time contracts for the airframe and engine were signed with North American Aviation in 1955 and Reaction Motors in 1956, the program had goals of flying the X-15 to a speed of Mach 6 and an altitude of 225,000 feet.

"It was a pretty aggressive move, a pretty gutsy step. We had reached Mach 1, 2 and even 2.5 in other airplanes. But then we lost a pilot when he crashed in one of those airplanes after reaching Mach 3," Engle said. "So the next step was Mach 6?"

As the prime contractor for the X-15 airframe, North American Aviation was responsible for checking out the vehicle before turning it over to the NACA, Air Force and Navy team so research flights could begin. It was up to the company’s chief test pilot, Scott Crossfield, to take the controls for the initial flights.

Crossfield flew a handful of captive flights with the X-15 slung beneath the wing of a B-52 mother ship. Some were intentional and some were not, as initial attempts for a drop test were aborted. Crossfield and his rocket plane finally were released from the B-52 on June 8, 1959, to make an unpowered glide to the lakebed below at Edwards Air Force Base in California.

With the X-15’s primary rocket engine, the XLR-99, still a few months away from being ready to fly, two of the smaller XLR-11 rockets were installed into the X-15 for Crossfield to use in making the first powered flight on Sept. 17, 1959.

The X-15 worked as anticipated that day, reaching a modest altitude of 52,341 feet, but easily breaking the sound barrier and recording a top speed of Mach 2.11 during the nine-minute flight.

"It was a big step, you bet," Engle said. "It showed that the propulsion unit was compatible with the airframe and that it would work. Crossfield was able to demonstrate the airplane would launch, fly free from the B-52, and that it could go supersonic without picking up any handling problems going through the transonic region."

The X-15 set world records for altitude and speed, but more importantly the research conducted during those test missions provided data that would benefit future operations and investigations related to aeronautics and spaceflight.

"I think they far exceeded what they thought was going to be the design parameters for the X-15 program. They wanted to achieve Mach 6 and they got to Mach 6.7. The design altitude was 225,000 feet and (NASA pilot) Joe Walker got it to 354,200 feet," Engle said.

But reaching those numbers didn't automatically allow the X-15's designers and pilots to declare success, Engle said. The whole process they went through to get to that point is where the lessons were taught and learned, sometimes harshly. In 1967, Air Force pilot Michael Adams was killed in the crash of an X-15.

"You learn so very much during the envelope expansion. Yes, there are some potholes that live within the envelope that you have to learn how to solve or avoid. But it's just as valuable to learn those as it is the lessons that wait for you at the edge of the envelope," Engle said.

› Read Pilot Notes from Engle's First X-15 Flight
› Read Radio Transcript from Engle's First X-15 Flight

Scientists Discover New Radiation Belt at Saturn

0 comments
North pole of Dione
Scientists using the Cassini spacecraft's Magnetospheric Imaging instrument have detected a new, temporary radiation belt at Saturn, located around the orbit of its moon Dione at about 377,000 kilometers (234,000 miles) from the center of the planet.

The new belt, which has been named "the Dione belt," was detected by the instrument for only a few weeks on three separate occasions in 2005. Scientists believe that newly formed charged particles in the Dione belt were gradually absorbed by Dione itself and another nearby moon, named Tethys, which lies slightly closer to Saturn at an orbit of 295,000 kilometers (183,304 miles).

The discovery was presented at the European Planetary Science Congress in Potsdam, Germany on September 14.

For more information about NASA's Cassini mission please visit: http://saturn.jpl.nasa.gov/

Friday, September 18, 2009

Spacecraft Talk Continued During JPL Wildfire Threat

0 comments
The Station fire, which started on Aug. 26, devoured brush in the foothills above JPL on Fri., Aug. 28As the flames of the raging brush fire dubbed the Station Fire threatened the northern edge of NASA's Jet Propulsion Laboratory on Saturday, Aug. 29, the managers of NASA's Deep Space Network prepared for the worst.

The Deep Space Operations Center at JPL is the nerve center for the Deep Space Network, an international network of antennas that send and receive information to interplanetary spacecraft. Staffed 24/7, 365 days a year, the JPL hub is constantly active connecting three major antenna sites, numerous mission operation centers run by NASA and an international group of space agencies, and more than 30 spacecraft flying throughout our solar system.

"We were more like the nervous center that weekend than the nerve center," said Wayne Sible of JPL, the network's deputy program manager for Deep Space Network development, operations and services.

The Deep Space Network operations managers knew that, fire or no fire, time was critical for sending software programs to and downloading diagnostic information from several spacecraft, including the Mars Reconnaissance Orbiter, which had an unexpected computer reboot the day the fire started on Aug. 26, and the Dawn spacecraft, on its way to the asteroid belt.

The network's antennas that send and receive information to spacecraft, located at Goldstone, in California's Mojave Desert; near Madrid, Spain; and near Canberra, Australia, were never in danger. But Sible and Jim Hodder, the network's operations manager, got word on Friday, Aug. 28, that the Station fire, which started in the San Gabriel Mountains above the Laboratory, was burning towards JPL. Emergency managers and senior JPL administrators called for JPL to be closed, except for essential personnel, on Friday evening.

A flurry of phone calls followed -- to the Deep Space Network team, the mission operation centers and ITT Systems Division, the contractor that provides the operators for the operations center at JPL.

On a phone call with Hodder, the team decided to move network operators to a facility in Monrovia, Calif., where other support work is normally conducted for the Deep Space Network. The Monrovia building - about 15 miles from JPL -- offered basic access to the critical systems, though the operators would not be able to use personalized computer scripts or notes that facilitate their work.

It seemed practical, since activating the emergency control center at the Goldstone complex in California's Mojave Desert would be more disruptive and require some suspension of communications while they moved staff 150 miles to that location.

Two of the five Deep Space Network operators on weekend duty were sent to Monrovia, but three volunteered to stay at the control center at JPL, to ensure systems continued to operate normally, to keep connections open with the flight projects, and to maintain the flow of engineering and science data to flight projects and scientists around the globe.

The three who stayed at JPL - along with about 40 other mission-critical personnel at any given time - were told not to spend much time outside. Hodder called frequently to check on the health of the crew and to obtain status reports on the network.

On Saturday afternoon, Sible and Hodder were ready to pull out those remaining three operators and put further communications with the network on hold if the fire reached the Mesa, a flat helipad and testing site at the northern edge of JPL.

That afternoon, the fire burned to within an eighth of a mile of the northern border of the lab. Emergency managers told staff to be ready to evacuate in 30 minutes.

Thankfully, with fire department handcrews cutting firebreaks, helicopters and fixed-wing aircraft dropping water and flame retardant, and the wind shifting, the danger passed on Saturday night. An unpleasant haze of smoke settled on the lab, but the air had cleared enough for the network operators in Monrovia to return to JPL Monday evening. The rest of JPL opened as usual on Tuesday morning at 6 a.m.

In the end, the Deep Space Network was able to complete its 182 scheduled uploading and downloading sessions with spacecraft over the weekend without interruption.

"It went very well," Sible said. "Nobody saw any hiccups whatsoever."

More information on the Deep Space Network is online at http://deepspace.jpl.nasa.gov/dsn/ .

Wednesday, September 16, 2009

North by Northwest – S'COOL on First Leg of Ocean Passage

0 comments
NASA's S'COOL project is now underway in a part of the world where few have sailed before: the open waters of the Northwest Passage.

S'COOL, Students' Cloud Observations On-Line, is one of eight scientific experiments onboard the ship Ocean Watch as it journeys around the Americas to help promote ocean health awareness. S'COOL was invited to be part of the expedition by the Around the Americas (ATA) project, a 13-month adventure that includes visits to 31 ports in 12 countries, where the Ocean Watch crew will promote public education and awareness about ocean science and marine conservation.

The Northwest Passage is one of the most awaited legs of the voyage; ten years ago, navigating through the icy region was nearly impossible.

A sea route between the Pacific and Atlantic Oceans, the passage runs through the Arctic Circle along the northern coast of North America. From west to east, it flows through the Bering Strait, Chukchi Sea, Beaufort Sea, and other waterways that weave around the Canadian Arctic Archipelago. It continues through Baffin Bay and the Davis Strait until meeting the Atlantic.

Dr. Lin Chambers, the S’COOL program’s project director from NASA Langley Research Center in Hampton, Va., is both thrilled and concerned about the opportunity to collect S’COOL data in the Northwest Passage.

“Having S’COOL onboard the Ocean Watch is very exciting,” said Chambers, “This is definitely the first time we’ve been able to have cloud observation reports from open water. But the sad reality about gathering data while in the Northwest Passage is that the route was once impassable. Now, with the melting of Arctic summer sea ice, it is passable."

For centuries, explorers have attempted to use the Northwest Passage as a trade route, but the Arctic pack ice prevented most of the attempts. The first successful crossing was in 1906 by Norwegian explorer Roald Amundsen – a difficult three-year voyage in a converted 47-ton herring boat. Due to the effects of climate change in recent years, the reduced pack ice causes Arctic shrinkage and allows ships, such as Ocean Watch, to transit its waterways over a few summer months.

The Ocean Watch crew, led by veteran circumnavigator Mark Schrader, includes scientists, a journalist, a photographer and an onboard educator. Together, they work to keep the ship safely on its course while managing a variety of tasks, from cooking meals and handling navigational duties to conducting scientific experiments. They also work together to educate the public about the conditions of the oceans’ health and its vital impact on our planet.

Zeta Strickland, Ocean Watch’s onboard educator, has high expectations about the results of the expedition.

"We hope people will understand that ocean health is an issue that needs to be addressed," said Strickland. "We are already seeing some parts of the oceans become increasingly acidic which has serious consequences for fish and other marine life. In the polar areas, increased water temperatures are resulting in more ice melt each summer that affects all animals including seals, shorebirds and polar bears. The changes these animals are facing is already having big impacts in the human communities throughout the regions."

During port stops throughout the trip, Strickland’s role as an educator gives her opportunities to teach others about these issues. She and the crew address ocean and environmental concerns to the local community, emphasizing that everything done on land affects the oceans.

They also use these visits to teach the public, especially children, about the S’COOL program.

"When we’ve been able to match our location to the satellite overpass times, we’ve been taking cloud observations,” explained Strickland. “We plan to share the information with the communities we visit and teach them how to make S’COOL reports."

The S’COOL information is useful for NASA Langley researchers who use it to verify data from NASA’s Terra and Aqua satellites that carry a NASA instrument called CERES (Clouds and the Earth’s Radiant Energy System.) The students’ work helps researchers to double-check the satellite instruments' measurements that can, in certain conditions, record more or less cloud cover than actually exists.

S’COOL observations, such as reports about contrails -- a type of cloud completely attributable to human activities made by the exhaust of aircraft engines -- provide scientists with useful information about the atmosphere. Due to their thinness, contrails are difficult for satellites to detect. And since changes in the amount of cloudiness can affect the climate, the thin contrail "clouds" are of great interest to researchers.

The S’COOL program has, since its inception in 1997, grown from a collaboration of NASA Langley scientists and several schools near NASA Langley to a more global program, with participation from schools in 78 countries.

S’COOL joins other experiments onboard Ocean Watch that include a jellyfish survey, a buoy that measures air pressure and sea surface temperature, and a study of the frequency and occurrence of whitecaps on breaking waves to evaluate their role in the air-sea transfer of heat, energy and the production of natural aerosols.

JISAO, the Joint Institute for the Study of the Atmosphere and Ocean at University of Washington, Seattle, is also partnering on the project. JISAO is gathering information about atmospheric aerosols in areas of the world where little or no data has been collected. Using a Microtops II sun photometer, the data will be compared to NASA’s satellite-based aerosol measurements and supplement NASA’s ground-based photometer network.

Ocean Watch is scheduled to finish its transit of the Northwest Passage in mid-September with Canadian port calls in St. John’s, Newfoundland and Halifax, Nova Scotia. Sailing south to the U.S., it will make stops in Boston; Newport, R.I.; New York; Charleston, S.C.; and Miami. The ship and crew will then sail to countries in the southern hemisphere of the Americas. Ocean Watch will return to U.S. waters in spring 2010.

Kris Ludwig, oceanographer and ATA project manager, echoes the feelings of the ship’s crew for more ocean health awareness.

"We hope to inspire people who interact with the project to better understand that humans and the ocean are inextricably linked - humans affect the oceans and the oceans affect the humans."

Related Links:

> NASA's S'COOL Program: Students' Cloud Observations On-Line
> Around the Americas

Tuesday, September 15, 2009

Twin NASA Commanders Twitter about Possible Space Meeting

0 comments
Two NASA astronaut commanders have perspectives like no others on Twitter -- the views of twin brothers preparing on opposite sides of the world to command both the space shuttle and the International Space Station.

The tweeting twins are astronauts Mark and Scott Kelly. Mark is the commander of space shuttle mission STS-134, set to launch in late 2010. Scott is the commander of station Expedition 26, also set to fly in late 2010. If schedules hold, the two may meet in space during their respective commands.

To follow the Kelly twins as they give insights to the world, and to each other, visit their respective Twitter accounts.

For Mark:

http://twitter.com/shuttlecdrkelly

For Scott:

http://twitter.com/stationcdrkelly

The brothers are natives of West Orange, N.J., and both are Navy captains. NASA selected them as astronauts in 1996.

Mark is a veteran of three space shuttle flights. He served as the pilot on missions STS-108 in 2001 and STS-121 in 2006 and commanded STS-124 in 2008. He has logged 38 days in space on his three flights.

Scott is a veteran of two space shuttle flights. He served as the pilot on mission STS-103 in 1999 and commanded STS-118 in 2007. He has logged almost 21 days in space and is currently preparing for a six-month stay aboard the station.

To follow all NASA astronauts currently on Twitter, visit:

http://twitter.com/NASA_astronauts

To find out more about the shuttle, station and all of NASA's programs, visit:

http://www.nasa.gov

Monday, September 14, 2009

NASA and ATK Schedule Motor Test for Ares Rocket on Sept. 10

0 comments
NASA and Alliant Techsystems Inc., or ATK, have rescheduled the test of the new first-stage solid rocket motor for the Ares I rocket. The static firing of the five-segment solid motor, designated development motor -1, is scheduled for 1 p.m. MDT on Thursday, Sept. 10, at the ATK test facility in Promontory, Utah. The first firing attempt on Aug. 27 was scrubbed because of an anomaly with the ground test controller.

The goal of this test is to obtain valuable thrust, roll-control, acoustics and vibration data as engineers continue to design the Ares vehicles.

To attend the test, journalists must register with ATK's Trina Patterson at 801-699-0943 by Sept. 8. News media bringing live broadcast trucks must request parking prior to the event.

The test will be carried live on the NASA media channel beginning 10 minutes prior to the firing. For NASA TV streaming video, downlink and schedule information, visit:

http://www.nasa.gov/ntv

In addition, the NASA Ares Twitter feed will be updated throughout the day. To follow, visit:

http://twitter.com/nasa_ares

After the test, representatives from NASA and ATK will hold a media teleconference at 1:45 p.m. To participate, reporters should e-mail Ashley Edwards at ashley.edwards-1@nasa.gov for dial-in information.

For more information about Ares, visit:

http://www.nasa.gov/ares

NASA Astronaut Brings Some Heat to San Diego

0 comments
Most people born before 1969 can remember where they were when man first stepped on the moon. Astronaut Tracy Caldwell cannot tell you where she was during that historic walk, since she was born after Apollo 11 landed on the moon, but she can tell you where she was on the 40th anniversary. She threw out the first pitch at a San Diego Padres baseball game.

“It was exhilarating,” said Caldwell about the first pitch, “but I’m keeping my day job.”

NASA Astronaut Tracy Caldwell signs autographs at the San Diego Air & Space MuseumCaldwell attended the game as part of NASA’s 2009 Hometown Heroes campaign. Throughout the summer, astronauts are visiting their home regions to spread NASA’s message about the importance of space exploration. This campaign is also celebrating the advent of a six-person crew on the International Space Station and the 40th anniversary of Apollo 11.

After throwing her strike, Caldwell presented the Padres with a photo of San Diego taken from the space station. Then she signed autographs for hundreds of fans who were thrilled to meet a hometown girl turned astronaut.

“Once I met Tracy, my feet didn’t touch the ground for the rest of the night!” said Steven Fitch, a worker at the ballpark. “The evening was so memorable that years from now I will still remember what happened.”

On the second day of Caldwell’s visit, she appeared at the San Diego Air & Space Museum in Balboa Park where she talked about her life as an astronaut and her upcoming mission later this year to the space station.

“I spent my whole life being a visitor to Balboa Park,” said Caldwell. “I went there to learn something new, be reminded of something past, and be taken by the sheer genius of discovery. You can’t help but dream when you’re there.”

NASA Astronaut Tracy Caldwell is welcomed on the Jumbotron by the San Diego Padres during the 2009 Hometown Heroes Campaign“Tracy is one of the best current astronauts I have seen speak,” said Francis French, Director of Education for the San Diego Air & Space Museum. “She really connected with the audience and made them feel like they, too, could be an astronaut.”

Caldwell told the crowd what it was like to live on the shuttle for 12 days as part of the STS-118 crew. She also answered varied questions about being an astronaut, from what to study in school to what it’s like to eat in space.

“There’s no greater mob to invite NASA into than a stadium filled with devoted fans of a favorite American pastime,” Caldwell said about the Hometown Heroes campaign. “Throw in the town astronaut and the crowd instantly connects. For this long-time baseball fan, what a pride-palooza for all Americans.”

Caldwell is currently assigned to spend six months on the space station as a Flight Engineer and member of the Expedition 23 crew.

For more information about the NASA Hometown Heroes 2009 campaign, visit: http://www.nasa.gov/astronauts

Wednesday, September 9, 2009

Fires in Los Angeles

0 comments
Triple-digit temperatures, extremely low relative humidities, dense vegetation that has not burned in decades, and years of extended drought are all contributing to the explosive growth of wildfires throughout Southern California. The Station fire, which began Aug. 26, 2009, in La Canada/Flintridge, not far from NASA's Jet Propulsion Laboratory, had reportedly burned 105,000 acres (164 square miles) of the Angeles National Forest by mid-day Aug. 31, destroying at least 21 homes and threatening more than 12,000 others. It is one of four major fires burning in Southern California at the present time.

This image was acquired mid-morning on Aug. 30 by the backward (northward)-viewing camera of the Multi-angle Imaging SpectroRadiometer (MISR) instrument on NASA's Terra satellite. The image is shown in an approximate perspective view at an angle of 46 degrees off of vertical. The area covered by the image is 245 kilometers (152 miles) wide. Several pyrocumulus clouds, created by the Station Fire, are visible above the smoke plumes rising from the San Gabriel Mountains north of Los Angeles in the left-center of the image. Smoke from the Station fire is seen covering the interior valleys along the south side of the San Gabriel Mountains, along with parts of the City of Los Angeles and Orange County, and can be seen drifting for hundreds of kilometers to the east over the Mojave Desert.

The accompanying plots are histograms that display the heights of the smoke plumes and wind speeds. In this data set, the plume is injecting smoke more than 7 kilometers (4.3 miles) above sea level.

MISR observes the daylit Earth continuously and every 9 days views the entire globe between 82 degrees north and 82 degrees south latitude. This image was generated from a portion of the imagery acquired during Terra orbit 51601.

MISR was built and is managed by NASA's Jet Propulsion Laboratory, Pasadena, Calif., for NASA's Science Mission Directorate, Washington, DC. The Terra satellite is managed by NASA's Goddard Space Flight Center, Greenbelt, Md. The MISR data were obtained from the NASA Langley Research Center Atmospheric Science Data Center. JPL is a division of the California Institute of Technology.

Tuesday, September 8, 2009

NASA Takes You on a New Tour of the Cryosphere

0 comments
A Tour of the Cryosphere 2009Back in 2002, NASA created a film using satellite data that took viewers on a tour of Earth’s frozen regions. This year, NASA visualizers are taking viewers on a return trip to see how things have changed over the years.

"The Tour of the Cryosphere 2009" combines satellite imagery and state-of-the-art computer animation software to create a fact-filled and visually stunning tour that shows viewers the icy reaches of Antarctica, the glacier-pocked regions along the Andes Mountains, the winter snows of the American West, the drifting expanse of polar sea ice, and the shrinking Jakobshavn glacier in Greenland.

However, viewers who saw the original will notice differences in the new version, also created by the Scientific Visualization Studio (SVS) at NASA's Goddard Space Flight Center, Greenbelt, Md. The new "Tour of the Cryosphere" video can be seen and downloaded from the Scientific Visualization Studio's Web site.

"What we did was incorporate more recent data and kept all scenes from the original that were dramatic and interesting," said film director and editor Horace Mitchell, who began updating the animation seven months ago, with help from visualizers Alex Kekesi and Cindy Starr. "The biggest change is that the entire film is in high definition.”

Another significant difference is evident as soon as the 5-minute animation opens. At the request of Earth scientists, who thought the film could be improved by a more realistic rendering of Antarctica, the team replaced the original imagery provided by Canada’s RADARSAT with the Landsat Image Mosaic of Antarctica (LIMA). Created from more than 1,000 high-resolution Landsat 7 scenes, the LIMA dataset seamlessly shows the entire continent in unprecedented and realistic detail.

LIMA image of Antarctica

The new version of "A Tour of the Cryosphere" features the world’s highest-resolution map of the icy continent, from the NASA-USGS Landsat Image Mosaic of Antarctica (LIMA) project. Credit: NASA/USGS
› Larger image

As the updated film takes viewers northward from Antarctica, the film treats viewers to the precise locations of glaciers scattered along the Andes Mountains in South America. The locations literally pop as the film continues its grand tour toward the planet’s northern climes.

After a quick tour of snowfall in the American West and its impact on vegetation in 2002 and 2003, the film moves across Canada and Alaska to show more recent satellite data of annual snow and ice overlaying these regions. From there, viewers travel to Earth's North Pole where they see the monthly average concentration of Arctic sea ice in 2009.

To help drive home the point that minimum sea ice levels have declined dramatically since 1979, the SVS team inserted a chart that tracks the levels of minimum ice cover, which typically occurs in September.

The animation then moves from Arctic sea ice to Greenland. More recent data now are used to show changes in the Jakobshavn glacier, which receded only slightly from 1942 to 2001. Beginning in 2002, the rate of ice loss jumped dramatically. The film shows the continued rates of recession over the past four years.

The animation shows the world in a single "shot" -- uninterrupted by cuts or scene changes, a technique that conveys the interconnectedness of the cryosphere and the reason scientists gather satellite data to monitor changes in the first place.

The film gives anyone who watches it a wealth of data collected from satellite observations, showing in detail the impact that recent changes are making on the planet, he said.

"We’re trying to tell NASA’s story with Hollywood's tools," Mitchell said.

Related Links

› NASA Goddard’s Scientific Visualization Studio
› Landsat Image Mosaic of Antarctica (LIMA)

Sunday, September 6, 2009

NASA Selects 16 Small Business Research and Technology Projects

0 comments
NASA has selected 16 small business projects to address important research and technology needs. The awards are part of NASA's Small Business Innovation Research (SBIR) and Small Business Technology Transfer (STTR) programs.

The SBIR program selected 12 proposals for negotiation of phase II contracts, with a total value of approximately $7.2 million. The awards went to 12 small, high technology firms in nine states.

The STTR program selected four proposals for negotiation of phase II contract awards, with a total value of approximately $2.4 million. The awards went to four small high technology firms in four states partnered with three research institutions in three states.

These selections are supplementary to the 142 phase II SBIR awards announced Oct. 28, 2008, and the 16 STTR phase II awards announced on April 15, 2009.

SBIR and STTR are part of the Innovative Partnerships Program Office at NASA Headquarters in Washington. The office partners with U.S. industry to infuse innovative technologies into NASA missions and transition them into commercially available products and services for the agency and other markets.

A few of the research areas being pursued among this group of selected proposals include:

- Innovative technologies for improvement in design and analysis of flight deck automation
- Technologies for long-term cryogenic propellant storage applications in-space, on the lunar surface and on Earth. The technologies also include fluid system components, cryogenic insulation and conditioning systems.
- Development of advanced power conversion, energy storage and power electronics to enable or enhance the capabilities of future science missions
- Technologies providing novel approaches in reconfigurable, reprogrammable communication systems for human and robotic missions

NASA's Ames Research Center at Moffett Field, Calif., manages the SBIR and STTR programs for the Innovative Partnerships Program. Individual projects are managed by NASA's field installations.

For a list of selected proposals, visit:

http://www.nasa.gov/offices/ipp/technology_infusion/sbir/index.html

For more information about the Innovative Partnerships Program, visit:

Friday, September 4, 2009

Warped Debris Disks Around Stars Are Blowin’ in the Wind

0 comments
The inner, yellow portion of HD 61005's disk spans 5.4 billion miles, or about the width of Neptune's orbit in our own solar systemThe dust-filled disks where new planets may be forming around other stars occasionally take on some difficult-to-understand shapes. Now, a team led by John Debes at NASA's Goddard Space Flight Center in Greenbelt, Md., finds that a star's motion through interstellar gas can account for many of them.

"The disks contain small comet- or asteroid-like bodies that may grow to form planets," Debes said. "These small bodies often collide, which produces a lot of fine dust." As the star moves through the galaxy, it encounters thin gas clouds that create a kind of interstellar wind. "The small particles slam into the flow, slow down, and gradually bend from their original trajectories to follow it."

Far from being empty, the space between stars is filled with patchy clouds of low-density gas. When a star encounters a relatively dense clump of this gas, the resulting flow produces a drag force on any orbiting dust particles. The force only affects the smallest particles -- those about one micrometer across, or about the size of particles in smoke.

"This fine dust is usually removed through collisions among the particles, radiation pressure from the star's light and other forces," explained Debes. "The drag from interstellar gas just takes them on a different journey than they otherwise would have had."

Working with Alycia Weinberger at the Carnegie Institution of Washington and Goddard astrophysicist Marc Kuchner, Debes was using the Hubble Space Telescope to investigate the composition of dust around the star HD 32297, which lies 340 light-years away in the constellation Orion. He noticed that the interior of the dusty disk -- a region comparable in size to our own solar system -- was warped in a way that matched a previously known warp at larger distances.

"Other research indicated there were interstellar gas clouds in the vicinity," Debes said. "The pieces came together to make me think that gas drag was a good explanation for what was going on."

"It looks like interstellar gas helps young planetary systems shed dust much as a summer breeze helps dandelions scatter seeds," Kuchner said.

As dust particles respond to the interstellar wind, a debris disk can morph into peculiar shapes determined by the details of its collision with the gas cloud. In a face-on encounter, such as that of the star HD 61005 in the constellation Puppis, the disk's edge bends gently away from the direction of motion. Fine dust trails behind, forming a cylindrical wake. If the disk instead slices edgewise through interstellar gas, the resulting headwind blows away fine dust from the portion inside the cloud, resulting in a lop-sided disk.

"The drag from interstellar gas only affects the outskirts of the disk, where the star's gravity can't really hold onto the material," Weinberger said.

The systems studied are about 100 million years old and resemble our own solar system shortly after the major planets formed. Although astronomers don't know whether planets lurk within the disks of these systems, a better understanding of processes affecting a disk's outer regions will shed light on how "ice giant" planets like Uranus and Neptune -- and the more distant swarm of small, icy bodies known as the Kuiper Belt -- formed within the solar system.

Astronomers have sometimes attributed warps and bends in debris disks to the presence of undiscovered planets or to past encounters with another star. "But we expect interstellar gas to be around -- it's everywhere," Debes said. "It's important to consider the ecology of these debris disks before running to such conclusions, and this model explains a lot of the weirdly shaped disks we see."

A paper describing the model appears in the September 1 issue of The Astrophysical Journal.

Related link:

NASA Supercomputer Shows How Dust Rings Point to Exo-Earths
http://www.nasa.gov/centers/goddard/news/topstory/2008/dust_rings.html

Wednesday, September 2, 2009

Honey Bees Turned Data Collectors Help Scientists Understand Climate Change

0 comments
Estimates are that there are somewhere between six and ten million species of insects on the planet, yet few are as charismatic as the honey bee.

Composite image of honeybees on honeycomb and beekeeper opening hivePart of an order of winged insects called Hymenoptera, honey bees are best known for being prodigious producers of honey, the sweet amber substance they produce by partially digesting and repeatedly regurgitating the sugar-rich nectar found within the petals of flowering plants. They're also the workhorses of the modern industrial agricultural system, relied upon to pollinate crops ranging from almonds to watermelons to peaches. And they're even noted dancers capable of performing an array of complex "waggle" dances to communicate.

And now -- thanks to an innovative project conceived by Wayne Esaias, a veteran oceanographer at NASA's Goddard Space Flight Center in Greenbelt, Md. -- bees have yet another role: that of climate data collectors.

Wayne Esaias, a NASA scientist, records the weight data of one of his beehivesWhen honey bees search for honey, colony scouts tend to scour far and wide and sample the area around a hive remarkably evenly, regardless of the size of the hive. And that, Esaias explained, means they excel in keeping tabs on the dynamics of flowering ecosystems in ways that even a small army of graduate students can not.

The key piece of data bees collect relates to the nectar flow, which in the mid-Atlantic region tends to come in a burst in the spring. Major nectar flows, typically caused by blooms of tulip-poplar and black locust trees, leave an unmistakable fingerprint on beehives -- a rapid increase in hive weight sometimes exceeding 20 pounds per day. When a nectar flow finishes, the opposite is true: hives start to lose weight, sometimes by as much as a pound a day.

By creating a burgeoning network of citizen scientists who use industrial-sized scales to weigh their hives each day -- HoneyBeeNet -- Esaias aims to quantify the dynamics of nectar flow over time. Participating beekeepers send their data to Esaias who analyzes it, and posts nectar flow trend graphs and other environmental data for each collection site on HoneyBeeNet's webpage.

Beehive in Friendship, MDThe size of HoneyBeeNet, which relies almost entirely on small-scale backyard beekeepers, has doubled over the last year and now includes more than 87 data collection sites. While the majority of sites are in Maryland, HoneyBeeNet now has sites in more than 20 states.

Data from the network, when combined with additional data that reach back to the 1920’s, indicate that the timing of spring nectar flows have undergone extraordinary changes. "Each year, the nectar flow comes about a half-day earlier on average," said Esaias. "In total, since the 1970s, it has moved forward by about month in Maryland."

Esaias and Goddard colleague Robert Wolfe recently compared nectar flow data from HoneyBeeNet to satellite data that measures the annual "green up" of vegetation in the spring, one of the first times that scientists have attempted such a comparison. They corresponded nearly perfectly, confirming the usefulness of the citizen-science derived data from HoneyBeeNet to address changes in nectar flows.

What's to blame for the remarkable warming trend in Maryland? Washington's growth has certainly played a role. Urban areas, explained Esaias, produce a "heat island" effect that causes temperatures in surrounding areas to creep upward. But, in addition to that, Esaias suspects that climate change is also contributing.

And that has him nervous. "A month is a long time. If this keeps up, and the nectar flows continue to come earlier and earlier, there's a risk that pollinators could end up out of sync with the plant species that they've pollinated historically," Esaias said.

Map of Maryland beekeepersHe's not the only researcher who's looking at this issue. The National Academies of Science published a landmark report in 2007 that highlighted the precarious status of pollinators in North America.

Many pollinators -- ranging from honey bees, to bumble bees, to lesser known species seem to be in the midst of protracted population declines. Managed honey bee colonies, for example, have seen their numbers fall from about 5.9 million in 1947 to just 2.4 million in 2005.

In most cases, it isn't clear what's causing the population declines or whether climate change is exacerbating the problem, though many researchers suspect that new types of viruses, mites and other parasites and pesticides are important factors.

"But it's not just the honey bees that we need to be looking at," said May Berenbaum, an ecologist at the University of Illinois at Urbana-Champaign and the lead author on the National Academies report. "For honey bees, at least we can truck them around or feed them when there's a problem. It's the wild species of pollinators that are the greatest cause for concern."

Bumblebees, wasps, butterflies, and countless other insects -- as well as some bats and birds -- are the glue that keeps many wild ecosystems intact through pollination. And scientists are only beginning to comprehend the potential consequences that could unfold if the pollinators and the plants that rely on them get so far out of sync that extinctions begin to occur.

"To borrow an old analogy that Paul Ehrlich often used, with the wild pollinators, losing a species is a bit like losing screws in a plane" said Berenbaum. "If you lose a few here or there, it's not the end of the world, and your plane can still fly. But if you lose too many, at some point, the whole plane can suddenly come apart in mid-flight."

Indeed, entomologists have hardly begun the task of identifying wild pollinators, not to mention determining definitely which species are threatened or how they might respond as the climate shifts. Esais' research offers hints about how bees might respond to climate change. Still, scientists estimate that there are more than 30,000 different bee species alone, and only about half of them have been formally described.

Though just a proverbial drop in the honey bucket, HoneyBeeNet is one way that citizens can help scientists better understand how climate change is affecting one species of pollinator. Alice Parks, a backyard beekeeper from West Friendship, Md., has participated for two years. She bought a used scale for just $26 at an auction, and weighs her hive every night.

“Weighing can be a chore sometimes,” she said. “But it’s such an incredibly rewarding project that it’s worth it. I’m learning so much about my bees that's making me a better beekeeper, but I’m also contributing to a larger project that’s helping scientists address environmental problems on a global scale.”

Related Links:

> HoneyBeeNet
> Buzzing about Climate Change
> Wayne Esaias Tracks Honey Bees in a Changing Climate

NASA And Google Launch Virtual Exploration of The Moon

0 comments
Forty years ago on July 20, 1969, the world watched as the crew of Apollo 11 took the first steps on the surface of the moon.

To celebrate this historic occasion, NASA and Google announced the launch of the Moon in Google Earth, an interactive, 3D atlas of the moon, viewable with Google Earth 5.0.

The announcement was made during a press conference at the Newseum in Washington, featuring remarks by Apollo 11 astronaut Buzz Aldrin; Alan Eustace, a Google senior vice president; Andrew Chaikin, author and space historian; and Anousheh Ansari, the first female space tourist.

With the Moon in Google Earth, users can explore a virtual moonscape, follow guided tours from astronauts Buzz Aldrin and Jack Schmidt, view high-resolution "street view" style panoramic images and see previously unreleased footage captured from the lunar surface.

Whether rediscovering iconic moments from the history of lunar exploration, or learning about them for the first time, the Moon in Google Earth enables users to better understand the moon and mankind's relationship to it using an immersive, 3D experience.

The result of a close collaboration with NASA, the Moon in Google Earth showcases current and historic content about the moon. All NASA data sets used in the Moon in Google Earth are included on a non-exclusive basis.

"Today's announcement builds on the ongoing relationship with Google that Ames Research Center initiated in November 2006, when we signed a Space Act Agreement to foster collaboration with our Silicon Valley neighbor," said S. Pete Worden, director of NASA's Ames Research Center at Moffett Field, Calif. "We're excited to be a part of this latest chapter in Google's efforts to bring virtual exploration of the moon to anyone with a computer."

In addition to satellite imagery and topographical data, the following layers can be explored:

• Featured Satellite Imagery – Explore overlaid satellite imagery and detailed descriptions of selected areas on the moon from Arizona State University's "Lunar Image of the Week."
• Spacecraft Imagery - View selected imagery captured by the Apollo Metric Camera, and the Clementine and the Lunar Orbiter spacecraft
• Apollo Missions – Travel back to the Apollo era and discover the landing sites of Apollo missions 11-17. Explore "street view" style panoramic images, watch previously unreleased footage from spacecraft films and read about the places astronauts saw on their trips to the moon.
• Guided Tours – Take a narrated tour of the moon with Apollo astronauts Buzz Aldrin (Apollo 11) and Jack Schmitt (Apollo 17)
• Historic Maps – Explore Apollo-era geologic and topographic maps of the moon.
• Human Artifacts – Learn about the various types of exploratory equipment that humans have left on the moon and where those objects can be found today.

To view the Moon in Google Earth, open Google Earth 5.0 and switch modes from "Earth" to "Moon" on the top toolbar. To learn more about Moon in Google Earth, visit: earth.google.com/moon.

The Moon in Google Earth was jointly developed by Google, the NASA Ames Intelligent Robotics Group, and the SETI Institute as part of NASA's Planetary Content project.

Data sets for the Moon in Google Earth were developed with the assistance of the United States Geologic Survey (USGS), Arizona State University and the Lunar and Planetary Institute. The Japan Aerospace Exploration Agency provided terrain data from the Kaguya orbiter. The initial release does not contain any imagery from the Lunar Reconnaissance Orbiter.

The NASA Lunar Mapping and Modeling Project provided a high-resolution base map and 3D terrain model covering a portion of the nearside lunar equatorial region, which was developed using new digital scans of the Apollo 15 Metric Camera (orbit 33) images made by Arizona State University and NASA's Johnson Space Center in Houston. he NASA Exploration Systems Mission Directorate Analogs Program provided content for the Apollo 17 tour.

For more information about NASA's plans to return to the moon and explore beyond visit exploration.nasa.gov.

Tuesday, September 1, 2009

Galaxies Demand a Stellar Recount

0 comments
Diagram illustrating the proportion of small to big stars in certain galaxies.
For decades, astronomers have gone about their business of studying the cosmos with the assumption that stars of certain sizes form in certain quantities. Like grocery stores selling melons alone, and blueberries in bags of dozens or more, the universe was thought to create stars in specific bundles. In other words, the proportion of small to big stars was thought to be fixed. For every star 20 or more times as massive as the sun, for example, there should be 500 stars with the sun's mass or less.

This belief, based on years of research, has been tipped on its side with new data from NASA's Galaxy Evolution Explorer. The ultraviolet telescope has found proof that small stars come in even bigger bundles than previously believed; for example, in some places in the cosmos, about 2,000 low-mass stars may form for each massive star. The little stars were there all along but masked by massive, brighter stars.

"What this paper is showing is that some of the standard assumptions that we've had - that the brightest stars tell you about the whole population of stars - this doesn't seem to work, at least not in a constant way," said Gerhardt R. Meurer, principal investigator on the study and a research scientist at Johns Hopkins University, Baltimore, Md.

Astronomers have long known that many stars are too dim to be seen in the glare of their brighter, more massive counterparts. Though the smaller, lighter stars outnumber the big ones, they are harder to see. Going back to a grocery story analogy, the melons grab your eyes, even though the total weight of the blueberries may be more.

Beginning in the 1950s, astronomers came up with a method for counting all the stars in a region, even the ones they couldn't detect. They devised a sort of stellar budget, an equation called the "stellar initial mass function," to estimate the total number of stars in an area of the sky based on the light from only the brightest and most massive. For every large star formed, a set number of smaller ones were thought to have been created regardless of where the stars sat in the universe.

"We tried to understand properties of galaxies and their mass by looking at the light we can see," Meurer said.

But this common assumption has been leading astronomers astray, said Meurer, especially in galaxies that are intrinsically small and faint.

To understand the problem, imagine trying to estimate the population on Earth by observing light emitted at night. Looking from above toward North America or Europe, the regions where more people live light up like signposts. Los Angeles, for example, is easily visible to a scientist working on the International Space Station. However, if this method were applied to regions where people have limited electricity, populations would be starkly underestimated, for example in some sections of Africa.

Images from NASA's Galaxy Evolution Explorer spacecraft and the Cerro Tololo International Observatory.
The same can be said of galaxies, whose speckles of light in the dark of space can be misleading. Meurer and his team used ultraviolet images from the Galaxy Evolution Explorer and carefully filtered red-light images from telescopes at the Cerro Tololo Inter-American Observatory in Chile to show that many galaxies do not form a lot of massive stars, yet still have plenty of lower-mass counterparts. The ultraviolet images are sensitive to somewhat small stars three times or more massive than the sun, while the filtered optical images are only sensitive to the largest stars with 20 or more times the mass of the sun.

The effects are particularly important in parts of the universe where stars are spread out over a larger volume -- the rural Africa of the cosmos. There could be about four times as many stars in these regions than previously estimated.

"Especially in these galaxies that seem small and piddling, there can be a lot more mass in lower mass stars than we had previously expected from what we could see from the brightest, youngest stars," Meurer said. "But we can now reduce these errors using satellites like the Galaxy Evolution Explorer."