Sunday, July 5, 2009

Five Years Ago, Cassini Began Orbiting Saturn

0 comments
NASA's Cassini mission has been orbiting Saturn for five Earth years as of June 30, 2009. That's about one sixth of a Saturnian year, enough time for the spacecraft to have observed seasonal changes in the planet, its moons and sunlight's angle on the dramatic rings.

Cassini passed through a gap in the rings as it entered orbit on June 30, 2004. It finished its prime mission in 2008 and continues to use its 12 instruments in an extended mission that includes extensive further studies of the moons Titan and Enceladus.

Cassini's view of Saturn.Saturn … Four Years On

As Saturn advances in its orbit toward equinox and the sun gradually moves northward on the planet, the motion of Saturn's ring shadows and the changing colors of its atmosphere continue to transform the face of Saturn as seen by Cassini.

This captivating natural color view was created from images collected shortly after Cassini began its extended Equinox Mission in July 2008. It can be contrasted with earlier images from the spacecraft's four-year prime mission that show the shadow of Saturn's rings first draped high over the planet's northern hemisphere, then shifting southward as northern summer changed to spring (see PIA06606 and PIA09793). During this time, the colors of the northern hemisphere have evolved from azure blue to a multitude of muted-colored bands.

This mosaic combines 30 images -- 10 each of red, green and blue light -- taken over the course of approximately two hours as Cassini panned its wide-angle camera across the entire planet and ring system on July 23, 2008, from a southerly elevation of 6 degrees.

Six moons complete this constructed panorama: Titan (5,150 kilometers, or 3,200 miles, across), Janus (179 kilometers, or 111 miles, across), Mimas (396 kilometers, or 246 miles, across), Pandora (81 kilometers, or 50 miles, across), Epimetheus (113 kilometers, or 70 miles, across) and Enceladus (504 kilometers, or 313 miles, across).

NASA’s Cassini spacecraft captured these images at a distance of approximately 1.1 million kilometers (690,000 miles) from Saturn and at a sun-Saturn-spacecraft, or phase, angle of 20 degrees. Image scale is 70 kilometers (43.6 miles) per pixel.

The Cassini-Huygens mission is a cooperative project of NASA, the European Space Agency and the Italian Space Agency. The Jet Propulsion Laboratory, a division of the California Institute of Technology in Pasadena, manages the mission for NASA's Science Mission Directorate, Washington, D.C. The Cassini orbiter and its two onboard cameras were designed, developed and assembled at JPL. The imaging operations center is based at the Space Science Institute in Boulder, Colo.

For more information about the Cassini-Huygens mission visit http://saturn.jpl.nasa.gov . The Cassini imaging team homepage is at http://ciclops.org .

Thursday, July 2, 2009

NASA Debuts the Entire 2008 Hurricane Season in New On-line Video

0 comments
NOAA's official map of tropical cyclone tracks during the Atlantic Ocean season 2008.Imagine watching all of the tropical depressions, storms and hurricanes of 2008 as they formed in the Atlantic Ocean Basin and either faded at sea or made landfall. Thanks to NASA technology and satellite data coupled with data from a National Oceanic and Atmospheric Administration (NOAA) operated satellite, you can see the tracks of storms from Arthur to Paloma from birth to death.

There were 17 tropical cyclones in the Atlantic Hurricane Season, which includes the North Atlantic Ocean, Caribbean Sea and Gulf of Mexico. Sixteen of the storms were strong enough to be named, and only one stayed a tropical depression.

The movie displays the infrared cloud imagery from the geosynchronous weather satellites, principally NOAA's Geostationary Operational Environmental Satellite (GOES)-12. The original cloud imagery was remapped and enhanced to display cloudtop texture. The GOES cloud images were overlaid on a true-color background map previously created from the Moderate Imaging Spectroradiometer (MODIS) instrument on NASA's Terra satellite.

The movie, which can be found on NASA's Hurricane Web page (www.nasa.gov/hurricane), or on the NASA GOES web page, is television production-quality. "These are large, high-resolution, colorful animations, made for use or editing by professional documentary producers or for anyone interested in hurricanes," said Dr. Dennis Chesters, GOES Project Scientist at the Laboratory for Atmospheres at NASA's Goddard Space Flight Center, Greenbelt, Md.

The movie depicts the entire 2008 hurricane season based on six months of GOES imagery at 30 minute intervals from May 1 to November 18, 2008. Each "frame" has a date and time stamp with the times in Universal Coordinated Time (UTC). There are 2 versions of the movie available: a 720p and 1080p HD-TV digital animation.

There's also a "highlights" movie that features the middle of the hurricane season from July 2 to September 14. The shortened "Highlights" movie from Bertha to Ike, July 2-Sept. 14 can be found here -- > Highlights

"Most versions are overlaid with hurricane names and storm tracks, with the tracks represented by dots whose size and color represent NOAA's hurricane Category 1 to 5 (on the Saffir-Simpson Scale)," Dr. Chesters said. "Some movies have captions summarizing each storm in a sidebar. Movies without named tracks are useful for forecasters and researchers who want to see the regional meteorology without visual distractions."

All of the movies in various formats labeled or unlabeled, large or small, are also on-line and downloadable at the GOES page for "Hurricane Alley 2008"
> Hurricane Alley

The NASA GOES Project office plans to make a movie of the 2009 season.

Related Links:

> Entire 2008 Hurricane Season, High Resolution
> Entire 2008 Hurricane Season, Low Resolution

Wednesday, July 1, 2009

Satellites Guide Relief to Earthquake Victims

0 comments
Formosat-2 satelliteOn May 28 at 2:24 a.m. local time, a deadly earthquake rocked Honduras, killing seven people and injuring several others, demolishing homes, damaging scores of other buildings, and sending terrified residents running through the streets.

"I woke up immediately, and all I could do was hug my youngest son and pray," says Dalia Martinez of San Pedro Sula, Honduras. "After a few minutes, my family and I went outside, where my neighbors were already gathered, likewise terrified about what happened but grateful we were all okay. Since then, we’ve been sleeping with flashlights and telephones within reach, because the aftershocks have been strong."

Fortunately for Martinez and other shaken residents, disaster officials knew exactly where to send help. A state-of-the-art Earth observation system called SERVIR directed them to the hardest hit areas.

Meaning "to serve" in Spanish, SERVIR is a joint effort of NASA, CATHALAC, the U.S. Agency for International Development, the Regional Center for the Mapping of Resources for Development, and other partners. The system uses satellite imagery to zero in on places where a flood, fire, hurricane, or earthquake has left destruction in its wake. Team members combine satellite data with ground observations, and display (for all to view) a near real-time map of crisis points. At a glance, decisions-makers can see the locations of most severe damage so they can send help in a hurry.

"The Honduras earthquake was a perfect example of SERVIR at its best," says Emil Cherrington, Senior Scientist at SERVIR's regional operational facility at CATHALAC in Panama. "It was like a chain reaction. People from agencies and organizations in several countries worked together after the earthquake to pinpoint precise locations where support was needed."

Breaking news stories revealed that the worst infrastructural damage was restricted, in general, to Honduras and Belize, so the SERVIR team at CATHALAC began to assemble baseline imagery and data for a bird’s eye view of those areas. They contacted Stuart Frye of NASA's Goddard Space Flight Center and asked him to arrange satellite imagery.

The next day, Frye notified the team that the Taiwanese would image the hardest hit areas by using their Formosat-2 satellite. In fact, the Taiwanese were already in action.

Dr. Cheng-Chien Liu of the National Cheng-Kung University of Taiwan explains: "President Ma Ying-Jeou of Taiwan and his delegation were visiting Belize the night earthquake struck. As news of the quake spread across the Pacific, all Taiwanese were shocked and very anxious to confirm their safety and that of the people who lived in the countries hit."

"We knew the fastest way to capture images of the disaster area would be to use Formosat-2. So I issued an urgent request for assistance to Dr. An-Ming Wu, the Deputy General Director of National Space Organization. Even though it was the Dragon Boat holiday and all Taiwanese were enjoying their family reunion, Dr. Wu called the Formosat-2 mission operation team to rush back to the control center. The three critical images were taken in record time!"

Dan Irwin, SERVIR Project Director at NASA's Marshall Space Flight Center, recalls the lightning-fast response: "I was in a bus in Berlin when I received an email from Dr. Liu telling me they had the images ready to send. It was early Saturday morning in Panama, but I called and woke Emil [Cherrington] up anyway to let him know."

"Dr. Liu was the one who lost sleep," says Cherrington. "He stayed up until 2 a.m. Taiwan time sending the images to our servers at CATHALAC. The data volume was huge, so the transfer was slow, but he wouldn't go home until he was sure we received all the images."

Tuesday, June 30, 2009

Herschel Opens Its Infrared Eyes

0 comments
Glowing light from clouds of dust and gas around and between the stars is visible clearly.The Herschel Space Observatory has snapped its first picture since blasting into space on May 14, 2009. The mission, led by the European Space Agency with important participation from NASA, will use infrared light to explore our cosmic roots, addressing questions of how stars and galaxies are born.

The new "sneak preview" image was taken in an early attempt to demonstrate that Herschel works, and, in particular, that its telescope is focused and correctly aligned with the science instruments, and to whet our appetites for what's yet to come. It shows the Whirlpool galaxy, which lies relatively nearby, about 35 million light-years away, in the constellation Canes Venatici.

The galaxy was first observed by Charles Messier in 1773, who gave the beauty its official name of Messier 51. Back then, astronomers, including William Herschel, the observatory's namesake, catalogued objects like these as fuzzy nebulae without knowing their true nature. Later, Messier 51 became one of the first of these fuzzy objects observed to have a spiral structure, a finding that eventually led to the revelation that galaxies full of stars exist far from our own.

The image is a composite of infrared light captured with Herschel's Photoconductor Array Camera and Spectrometer at three wavelengths: 70, 100 and 160 microns. Herschel's full wavelength range spans 55 to 672 microns. The blue and white areas show where stars are actively forming, while the brown regions contain cold dust. The brightest blue dot at top left is a smaller, companion galaxy.

Longer-wavelength light inherently does not produce pictures with resolution as high as those obtained at shorter wavelengths, such as visible light. However, because Herschel's mirror is the largest infrared astronomy mirror ever launched in space (3.5 meters, or about 11.5 feet across), it can take the sharpest pictures to date at the particular wavelengths it observes.

During its prime mission phase, NASA's Spitzer Space Telescope, also a space-based infrared telescope, could see shorter-wavelength light, with wavelengths ranging from 3.6 to 160 microns. Because the two telescopes are able to see, for the most part, different wavelengths of light, their results complement each other, highlighting the multifaceted features of cosmic objects. Spitzer's shorter-wavelength infrared view of the Whirlpool galaxy, in comparison to a visible-light view, can be seen at http://gallery.spitzer.caltech.edu/Imagegallery/image.php?image_name=ssc2004-19a .

Herschel is in the final stretches of its journey to the second Lagrange point of the Earth-sun system. The observatory will spend its lifetime, estimated to be at least three-and-a-half-years, orbiting this point, which is about 1.5 million kilometers (930,000 miles) from Earth on the opposite side of our planet from the sun. After a cover protecting the telescope's instruments was popped open on June 14, engineers and scientists commanded the telescope to take its first test picture. The telescope is still being commissioned, with science observations expected to begin later this year.

Herschel is a European Space Agency cornerstone mission, with science instruments provided by a consortia of European institutes and with important participation by NASA. NASA's Herschel Project Office is based at NASA's Jet Propulsion Laboratory. JPL contributed mission-enabling technology for two of Herschel's three science instruments. The NASA Herschel Science Center, part of the Infrared Processing and Analysis Center at the California Institute of Technology in Pasadena, supports the United States astronomical community. Caltech manages JPL for NASA. More information is online at http://www.herschel.caltech.edu .

The NASA Herschel Science Center is part of the consortium that developed the Photoconductor Array Camera and Spectrometer.

Monday, June 29, 2009

New JPL Building Goes Green for the Gold

0 comments
A rooftop, drought-resistant garden is among the When residents of the top floors of JPL's new Flight Projects Center look out their windows down to the roof of the building's auditorium, they won't see black tar. Instead, they'll witness what looks more like Joshua Tree, Calif. -- desert, drought-resistant plants dotting sandy ground.

The plants do more than enhance the view; they are part of the building's many "green" features. In fact, the building is so green that JPL is going for the gold -- a gold certification, that is, under the Leadership in Energy and Environmental Design rating system, set up by the non-profit U.S. Green Building Council.

The six-story Flight Projects Center will house missions in the busy design and development phases, when engineers and scientists from all around the world must work together closely. The first tenants are expected to move in this September.

To achieve a gold-level certification, the building must meet certain criteria. In general, it must consume water, energy and resources efficiently; treat the environment in friendly ways; and create a healthy and comfortable indoor workspace. Some of the building's green assets are listed here:

• A green, living roof will keep the building cool in the summer and warm in the winter. The green roof will also help minimize storm water runoff into the Arroyo Seco, a dry riverbed near JPL.

• Outdoor lights will be used solely for safety purposes. The lights are directed toward the ground, reducing the amount of light pollution that escapes to the night sky.

• Desert plants on the roof and the rest of the landscape will require 72 percent less water than a typical landscape design in Southern California.

• Low-flow faucets and toilets will reduce water use by 40 percent compared with typical fixtures. The building will save an estimated 500,000 gallons of water every year.

• Improved wall insulation, efficient chillers and boilers, window shading devices and the green roof will greatly reduce energy needs.

• More than 75 percent of the waste generated during construction was diverted from a landfill to a local recycling facility. Wood was acquired from Forest Stewardship Council certified suppliers, ensuring sustainable harvesting of trees.

• The paints and other surface materials have low levels of undesirable, toxic fumes.

• The heating and cooling system is "smart" -- it knows whether people are in a room and adjusts the temperature and ventilation accordingly.

• The janitorial staff will use green cleaning products and practices.

• Showers and bike racks will encourage people to leave their cars at home, and bike or walk to work.

More information about the Leadership in Energy and Environmental Design rating system and the U.S. Green Building Council is online at http://www.usgbc.org .

Sunday, June 28, 2009

NASA Scientists Bring Light to Moon's Permanently Dark Craters

0 comments
This color image is the highest resolution topography map to date of the moon's south pole.A new lunar topography map with the highest resolution of the moon's rugged south polar region provides new information on some of our natural satellite's darkest inhabitants - permanently shadowed craters.

The map was created by scientists at NASA's Jet Propulsion Laboratory, Pasadena, Calif., who collected the data using the Deep Space Network's Goldstone Solar System Radar located in California's Mojave Desert. The map will help Lunar Crater Observation and Sensing Satellite (LCROSS) mission planners as they target for an encounter with a permanently dark crater near the lunar South Pole.

"Since the beginning of time, these lunar craters have been invisible to humanity," said Barbara Wilson, a scientist at NASA's Jet Propulsion Laboratory in Pasadena, Calif., and manager of the study. "Now we can see detailed topography inside these craters down to 40 meters [132 feet] per pixel, with height accuracy of better than 5 meters [16 feet]."

The terrain map of the moon's south pole is online at: http://www.nasa.gov/topics/moonmars/features/moon-20090618.html .

Scientists targeted the moon's south polar region using Goldstone's 70-meter (230-foot) radar dish. The antenna, three-quarters the size of a football field, sent a 500-kilowatt-strong, 90-minute-long radar stream 373,046 kilometers (231,800 miles) to the moon. Signals were reflected back from the rough-hewn lunar terrain and detected by two of Goldstone's 34-meter (112-foot) antennas on Earth. The roundtrip time, from the antenna to the moon and back, was about two-and-a-half seconds.

The scientists compared their data with laser altimeter data recently released by the Japanese Aerospace Exploration Agency's Kaguya mission to position and orient the radar images and maps. The new map provides contiguous topographic detail over a region approximately 500 kilometers (311 miles) by 400 kilometers (249 miles).

Funding for the program was provided by NASA's Exploration Systems Mission Directorate. JPL manages the Goldstone Solar System Radar and the Deep Space Network for NASA. JPL is managed for NASA by the California Institute of Technology in Pasadena.

More information about the Goldstone Solar System Radar and Deep Space Network is at http://deepspace.jpl.nasa.gov/dsn . More information about NASA's exploration program to return humans to the moon is at http://www.nasa.gov/exploration .

Friday, June 26, 2009

NASA Lunar Mission Successfully Enters Moon Orbit

0 comments
After a four and a half day journey from the Earth, the Lunar Reconnaissance Orbiter, or LRO, has successfully entered orbit around the moon. Engineers at NASA's Goddard Space Flight Center in Greenbelt, Md., confirmed the spacecraft's lunar orbit insertion at 6:27 a.m. EDT Tuesday.

During transit to the moon, engineers performed a mid-course correction to get the spacecraft in the proper position to reach its lunar destination. Since the moon is always moving, the spacecraft shot for a target point ahead of the moon. When close to the moon, LRO used its rocket motor to slow down until the gravity of the moon caught the spacecraft in lunar orbit.

"Lunar orbit insertion is a crucial milestone for the mission," said Cathy Peddie, LRO deputy project manager at Goddard. "The LRO mission cannot begin until the moon captures us. Once we enter the moon's orbit, we can begin to buildup the dataset needed to understand in greater detail the lunar topography, features and resources. We are so proud to be a part of this exciting mission and NASA's planned return to the moon."

A series of four engine burns over the next four days will put the satellite into its commissioning phase orbit. During the commissioning phase each of its seven instruments is checked out and brought online. The commissioning phase will end approximately 60 days after launch, when LRO will use its engines to transition to its primary mission orbit.

For its primary mission, LRO will orbit above the moon at about 31 miles, or 50 kilometers, for one year. The spacecraft's instruments will help scientists compile high resolution, three-dimensional maps of the lunar surface and also survey it at many spectral wavelengths.

The satellite will explore the moon's deepest craters, examining permanently sunlit and shadowed regions, and provide understanding of the effects of lunar radiation on humans. LRO will return more data about the moon than any previous mission.

For more information about the LRO mission, visit:

http://www.nasa.gov/lro

Wednesday, June 24, 2009

NASA Reschedules Test of Max Launch Abort System for June 25

0 comments
Because of delays completing preliminary tests at the launch site, NASA has rescheduled the test launch of the Max Launch Abort System, or MLAS, to no earlier than June 25 at the agency's Wallops Flight Facility on Wallops Island, Va. The launch window will extend from approximately 5:45 a.m. to 10 a.m. EDT.

Because of the possibility of further schedule changes, news media representatives should contact Rebecca Powell at 757-824-1139 or Ashley Edwards at 202-358-1756 to confirm the exact date and time of the launch.

The unpiloted test is part of an effort to design a system for safely propelling future spacecraft and crews away from hazards on the launch pad or during the climb to orbit. This system was developed as an alternative concept to the launch abort system chosen for NASA's Orion crew capsule.

The 33-foot-high MLAS vehicle will be launched to an altitude of approximately one mile to simulate an emergency on the launch pad. A full-scale mockup of the crew capsule will separate from the launch vehicle and parachute into the Atlantic Ocean.

For more information about MLAS, visit:

http://www.nasa.gov/centers/wallops/missions/mlas.html

For more information about the Constellation Program, visit:

http://www.nasa.gov/constellation

Tuesday, June 23, 2009

Jet Streams Suspected of Triggering Sunspots

0 comments
A helioseismic map of the solar interiorThe sun is in the pits of a century-class solar minimum, and sunspots have been puzzlingly scarce for more than two years. Now, for the first time, solar physicists might understand why.

At an American Astronomical Society press conference this week in Boulder, Colorado, researchers announced that a jet stream deep inside the sun is migrating slower than usual through the star's interior, giving rise to the current lack of sunspots.

Rachel Howe and Frank Hill of the National Solar Observatory (NSO) in Tucson, Arizona, used a technique called helioseismology to detect and track the jet stream down to depths of 7,000 km below the surface of the sun. The sun generates new jet streams near its poles every 11 years, they explained to a room full of reporters and fellow scientists. The streams migrate slowly from the poles to the equator and when a jet stream reaches the critical latitude of 22 degrees, new-cycle sunspots begin to appear.

Howe and Hill found that the stream associated with the next solar cycle has moved sluggishly, taking three years to cover a 10 degree range in latitude compared to only two years for the previous solar cycle.

The jet stream is now, finally, reaching the critical latitude, heralding a return of solar activity in the months and years ahead.

An artist's concept of the Solar Dynamics Observatory. "It is exciting to see", says Hill, "that just as this sluggish stream reaches the usual active latitude of 22 degrees, a year late, we finally begin to see new groups of sunspots emerging."

The current solar minimum has been so long and deep, it prompted some scientists to speculate that the sun might enter a long period with no sunspot activity at all, akin to the Maunder Minimum of the 17th century. This new result dispells those concerns. The sun's internal magnetic dynamo is still operating, and the sunspot cycle is not "broken."

Because it flows beneath the surface of the sun, the jet stream is not directly visible. Hill and Howe tracked its hidden motions via helioseismology. Shifting masses inside the sun send pressure waves rippling through the stellar interior. So-called "p modes" (p for pressure) bounce around the interior and cause the sun to ring like an enormous bell. By studying the vibrations of the sun's surface, it is possible to figure out what is happening inside. Similar techniques are used by geologists to map the interior of our planet.

In this case, researchers combined data from GONG and SOHO. GONG, short for "Global Oscillation Network Group," is an NSO-led network of telescopes that measures solar vibrations from various locations around Earth. SOHO, the Solar and Heliospheric Observatory, makes similar measurements from space.

"This is an important discovery," says Dean Pesnell of NASA's Goddard Space Flight Center. "It shows how flows inside the sun are tied to the creation of sunspots and how jet streams can affect the timing of the solar cycle."

There is, however, much more to learn.

"We still don't understand exactly how jet streams trigger sunspot production," says Pesnell. "Nor do we fully understand how the jet streams themselves are generated."

To solve these mysteries, and others, NASA plans to launch the Solar Dynamics Observatory (SDO) later this year. SDO is equipped with sophisticated helioseismology sensors that will allow it to probe the solar interior better than ever before.

"The Helioseismic and Magnetic Imager (HMI) on SDO will improve our understanding of these jet streams and other internal flows by providing full disk images at ever-increasing depths in the sun," says Pesnell.

Continued tracking and study of solar jet streams could help researchers do something unprecedented--accurately predict the unfolding of future solar cycles. Stay tuned for that!

Related Links:

> Sonograms of Sun Explain Missing Sunspots (American Astronomical Society/Solar Physics Division)
> Solar Dynamics Observatory (Goddard Space Flight Center)

Monday, June 22, 2009

LRO/LCROSS Launch Date Set

0 comments
NASA's Lunar Reconnaissance Orbiter and Lunar Crater Observation and Sensing Satellite are set to lift off together aboard an Atlas V rocket on Thursday, June 18, at 5:12 p.m. EDT. Two additional launch opportunities are available at 5:22 p.m. and 5:32 p.m.

In preparation for liftoff, the Atlas V launch vehicle is scheduled to roll out to the pad Wednesday at 10 a.m.

Countdown milestones can be found on NASA's Launch Blog beginning at 2 p.m. EDT.

Atlas V Rolls to Launch Pad
In the left background is space shuttle Endeavour on pad 39A, on the right foreground is the Atlas V with LRO and LCROSS spacecrafts on top at their launch pad.
Mission Overview

NASA's Lunar Reconnaissance Orbiter and Lunar Crater Observation and Sensing Spacecraft will fly to the moon atop the same Atlas V rocket, although they will use vastly different methods to study the lunar environment. LRO will go into orbit around the moon, turning its suite of instruments towards the moon for thorough studies. The spacecraft also will be looking for potential landing sites for astronauts.

LCROSS, on the other hand, will guide an empty upper stage on a collision course with a permanently shaded crater in an effort to kick up evidence of water at the moon's poles. LCROSS itself will also impact the lunar surface during its course of study.

Liftoff currently is scheduled for June 18 at 5:12 p.m. EDT. There are two more launch opportunities that day at 5:22 p.m. and 5:32 p.m.

Additional Resources
› LRO Fact Sheet
› LRO/LCROSS Press Kit
› LRO/LCROSS Launch Coverage Events

Sunday, June 21, 2009

Scientists Search for a Pulse in Skies Above Earthquake Country

0 comments
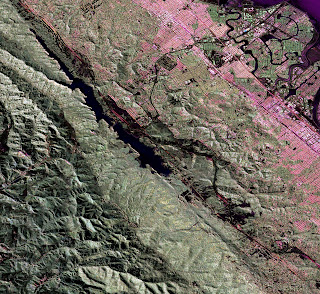
UAVSAR image of the San Andreas fault in the San Francisco Bay area just west of San Mateo and Foster City.NASA Gives California's San Andreas, Other Faults a 3-D Close-up

Story Highlights
• New NASA 3-D airborne radar to study California's earthquake faults.
• Radar sees below the surface to measure buildup and release of strain along faults.
• Data can be used to guide rescue and damage assessment efforts after a quake.
• LA basin, San Francisco Bay among areas to be studied.

When a swarm of hundreds of small to moderate earthquakes erupted beneath California's Salton Sea in March, sending spasms rumbling across the desert floor, it set off more than just seismometers. It also raised the eyebrows of quite a few concerned scientists. The reason: lurking underground, just a few kilometers to the northeast, lays a sleeping giant: the 160-kilometer-(100-mile) long southern segment of the notorious 1,300-kilometer- (800-mile) long San Andreas fault. Scientists were concerned that the recent earthquake swarm at the Salton Sea's Bombay Beach could perhaps be the straw that broke the camel's back, triggering "the big one," a huge earthquake that could devastate Southern California.

The southern end of the San Andreas has remained silent, at least for now. But the earthquake swarm and more recent, widely felt earthquakes in the Los Angeles area have stirred renewed interest in earthquake research. A multi-year project currently under way at NASA's Jet Propulsion Laboratory, Pasadena, Calif., is seeking to improve our understanding of these mysterious and sometimes deadly natural hazards by using a groundbreaking, JPL-developed airborne radar to study earthquake processes along the San Andreas and other California faults.

The 'Mother of California Faults'

Formed 15 to 20 million years ago, the San Andreas has defined California's seismic history and dramatically altered its landscape. It serves as the boundary between the two massive tectonic plates upon which the Golden State rides: the Pacific and North American plates.

Grinding horizontally past each other in a roughly north-south direction at up to 3.5 centimeters (1.4 inches) a year, the fault is a battle zone of pulverized rock, extending to depths of at least 16 kilometers (10 miles). In some places, the plates "creep" quietly past each other, producing small to moderate earthquakes, in a process known as aseismic creep.

But other parts of the fault get "stuck." They lock in place for sometimes hundreds of years before eventually releasing their pent-up frustrations in epic lunges, such as those responsible for the large magnitude 7.9 earthquakes that struck a then sparsely populated Southern California near Fort Tejon in 1857, and San Francisco in 1906.

From San Luis Obispo south to the Cajon Pass near San Bernardino, the San Andreas forms a largely unbroken line that is often clearly visible from the ground and air. South of Cajon Pass, however, the fault zone becomes more complex. Here, several different faults share the "burden" of moving the tectonic plates, including the San Andreas and the parallel and intersecting San Jacinto and southern San Andreas faults, among others. North of San Luis Obispo, the fault zone similarly splits into nearly parallel faults, with the Hayward and Calaveras faults sharing the plate motion with the San Andreas in the San Francisco Bay area.

Paleoseismological studies dating back 1,500 years have shown that large earthquakes occur on the southern San Andreas about every 250 to 300 years, on average. Yet the extreme southern segment of the fault hasn't budged for about 320 years. It is apparently overdue, primed for another large event.

Last year, the United States Geological Survey estimated that such a large earthquake, originating near the Salton Sea and rupturing the ground northward to near Lake Hughes in Los Angeles County, could devastate an eight-county region, killing up to 1,800, injuring 50,000, displacing a quarter million people, significantly damaging 300,000 buildings and causing an estimated $213 billion in damage.

Searching for Clues From Above and Below

Like doctors assessing the health of a patient, scientists use a broad array of tools to "listen" to the San Andreas and other faults, looking for clues about their past, present and future behavior. They dig trenches across faults, and place instruments, such as seismographs, creep meters and stress meters, into the ground to try to detect any changes that might be occurring above or below Earth's surface.

Increasingly, they also rely on space-based technologies, such as those being developed at JPL. Space-based instruments can image minute Earth movements to within a few centimeters (fractions of an inch), measuring the slow buildup of deformation along faults and mapping ground deformation after earthquakes occur. Among these tools are the Global Positioning System and interferometric synthetic aperture radar, or InSAR.

Until recently, the only InSAR data available for the San Andreas and other California faults have come from European Space Agency, Canadian and Japanese radar satellites. But those satellites aren't dedicated to or optimized for studying earthquakes, and the availability of their data is limited.

A New 3-D Radar Tool

Now, JPL scientists have added a new airborne radar tool to their arsenal. Called the Uninhabited Aerial Vehicle Synthetic Aperture Radar, or UAVSAR, this L-band wavelength radar flies aboard a modified NASA Gulfstream III aircraft from NASA's Dryden Flight Research Center, Edwards, Calif. The compact, reconfigurable radar, housed in a pod under the aircraft's fuselage, uses pulses of microwave energy to detect and measure very subtle deformations in Earth's surface, such as those caused by earthquakes, volcanoes, landslides and glacier movements.

UAVSAR works like this: flying at a nominal altitude of 13,800 meters (45,000 feet), the radar collects data over a selected region. It then flies over the same region again, minutes to months later, using the aircraft's advanced navigation system to precisely fly over the same path to an accuracy of within 4.6 meters (15 feet). By comparing these camera-like images, called interferograms, over time, scientists can measure the slow surface deformations involved with the buildup and release of strain along earthquake faults.

(UAVSAR is currently wrapping up a two-month expedition in Greenland and Iceland to study the flow of glaciers and ice streams. See http://www.jpl.nasa.gov/news/news.cfm?release=2009-075 and http://www.jpl.nasa.gov/news/features.cfm?feature=2156 ).

'Mowing the Lawn'

Last November, JPL scientists began conducting a series of UAVSAR flights over regions of Northern and Southern California that are actively deforming and are marked by frequent earthquakes. About every six months for the next several years, the scientists will precisely repeat the same flight paths to produce interferograms. From these data, 3-D maps will be created for regions of interest, including the mighty San Andreas and other California faults, extending from the Mexican border to Santa Rosa in the northern San Francisco Bay. Last month, the scientists completed their first full map of the San Andreas. Some regions, such as Parkfield on the central San Andreas, and the Hayward fault, have already had more than one flyover.

"We'll be 'mowing the lawn,' so to speak, mapping the San Andreas and adjacent faults, segment by segment, and then periodically repeating the same radar observations," said Andrea Donnellan, one of three JPL principal investigators on the UAVSAR fault mapping project, and program area lead for Natural Disasters in NASA Headquarters' Science Mission Directorate, Washington.

"By comparing these repeat-pass radar observations, we hope to measure any crustal deformations that may occur between observations, allowing us to 'see' the amount of strain building up in the San Andreas and adjoining faults,” Donnellan said. “This will give us a much clearer picture of which faults are active and at what rates they're moving, both before earthquakes and after them."

Donnellan said the UAVSAR fault mapping data will substantially improve our knowledge of regional earthquake hazards in California. "The 3-D UAVSAR data will allow scientists to bring entire faults into focus, allowing them to see the faults not just at their surfaces, but also at depth," she said. "When integrated into computer models, the data should give scientists a much clearer picture of California's complex fault systems, such as those in the Los Angeles basin and in the area around the Salton Sea."

The scientists will estimate the total displacement occurring in each region. As more observations are collected, they expect to be able to determine how strain is partitioned between individual faults. They'll also be able to measure ground signals caused by human activities, such as pumping water into or out of the ground or drilling for oil.

The UAVSAR flights will serve as a baseline for pre-earthquake activity. Should earthquakes occur during the course of this project, the team will measure the deformation at the time of the earthquakes to determine the distribution of slip on the faults, and then monitor longer-term motions after the earthquakes to learn more about fault zone properties.

"Airborne UAVSAR mapping can allow a rapid response after an earthquake to determine what fault was the source and which parts of the fault slipped during the earthquake," said Eric Fielding, another JPL principal investigator on the UAVSAR project. "Information about the earthquake source can be used to estimate what areas were most affected by the earthquake shaking to guide rescue and damage assessment response."

The UAVSAR data will also be used to test the earthquake forecasting methodology developed by UC Davis scientist John Rundle under NASA's QuakeSim project (see http://www.jpl.nasa.gov/news/news.cfm?release=2003/-074 ). The experiment identifies regions that have a high probability for earthquakes in the near future.

Mapping Faults from the Salton Sea to Santa Rosa

Donnellan's research will focus on Southern California between the Salton Sea and the Pacific coast, along with the Los Angeles basin, the seismically active Transverse Ranges (the east-west-oriented mountain ranges located between San Diego and Santa Barbara), and the San Francisco Bay area up through Santa Rosa.

Meanwhile, JPL colleagues Paul Lundgren and Zhen Liu will focus on the central San Andreas fault between the Bay Area and Los Angeles. This area is a transition zone between the creeping part of the fault north of the Parkfield segment, which has experienced fairly regular moderate earthquakes of around magnitude 6, and the Carrizo Plain segment, which ruptured in the 1857 Fort Tejon earthquake. They will also integrate UAVSAR with GPS and satellite InSAR data to form more complete models of how the fault slips over time.

JPL's Eric Fielding will focus on the Hayward fault along the east side of San Francisco Bay, identified as having the highest risk of a damaging earthquake in the Bay Area. The Hayward fault creeps in some parts, but also ruptured in a magnitude 6.8 to 7.0 earthquake in 1868 that caused extensive damage due to its location in the heart of the Bay Area. Fielding will analyze this creep to determine how much of the fault's overall motion is being released gradually, without large earthquakes, and estimate how much of the fault has accumulated stress since the 1868 quake that could rupture again. From these data, Fielding's team hopes to develop models of how stress and strain is evolving on the fault system and infer properties of the fault zone.

"Previous studies of the Hayward fault using satellite InSAR were limited by fixed satellite orbits and shorter radar wavelengths that only provided useful measurements in the urbanized areas of the San Francisco Bay," said Fielding. "UAVSAR will give us a complete picture of the 3-D deformation and map much finer details than are possible from space."

Initial science results from the UAVSAR fault mapping project will be available some time after the second round of mapping flights are completed. In the meantime, the science team is busy constructing computer models to compare with the actual UAVSAR data once they become available.

What's Next?

Donnellan said UAVSAR is also serving as a flying testbed to evaluate the tools and technologies for future space-based radars, such as those planned for a NASA mission currently in formulation called the Deformation, Ecosystem Structure and Dynamics of Ice, or DESDynI. That mission, which will study hazards such as earthquakes, volcanoes and landslides, as well as global environmental change, will use both a light detection and ranging sensor, or lidar, and an L-band radar that is very similar to UAVSAR's but with a much wider ground swath. DESDynI will be capable of providing repeat-pass interferometric data every eight days.

Once DESDynI is in orbit, UAVSAR will be used to calibrate its data and will complement its measurements by filling in gaps in its coverage.

"The Earth science community is anxiously awaiting the launch of DESDynI in a few years," Donnellan said. "In the meantime, UAVSAR data will give us a head start on better understanding California's complex fault systems. Its data will also help state and local governments mitigate losses from future earthquakes, including the inevitable 'big one' we all know is in our future."

To learn more about UAVSAR, visit: http://uavsar.jpl.nasa.gov .

To learn more about other ongoing JPL earthquake research programs, visit: http://quakesim.jpl.nasa.gov/ . Results of an earlier InSAR study of deformation in the San Francisco Bay Area by Fielding are available at http://www-radar.jpl.nasa.gov/CrustalDef/san_fran/index.html .

Thursday, June 18, 2009

NASA Awards Hydrospheric and Biospheric Science Services Contract

0 comments
NASA has selected Sigma Space Corporation of Lanham, Md., to provide Hydrospheric and Biospheric Sciences Support Services. The total maximum ordering value of the cost-plus fixed fee contract will be $120 million.

Sigma will provide support to the Hydrospheric and Biospheric Sciences Laboratory at NASA's Goddard Space Flight Center in Greenbelt, Md. Sigma will support research involving satellite remote sensing as well as field and aircraft instruments for measuring Earth, oceanic, biospheric and atmospheric processes; scientific and engineering support for the development and calibration of remote sensing instruments; and the development of data systems for the production and distribution of satellite products.

This contract will support the National Polar-orbiting Operational Environmental Satellite System (NPOESS) Preparatory Project Science Data Segment; Earth Observing-1; Lunar Reconnaissance Orbiter Project and the Earth Observing System missions Terra, Aqua and Aura.

The work will be performed primarily at Goddard. The period of performance for the contract is from June 1, 2009, through May 31, 2014.

For information about NASA and agency programs, visit:

http://www.nasa.gov

Wednesday, June 17, 2009

NASA Sets Media Availability for Human Space Flight Committee

0 comments
The chair of the Review of U.S. Human Space Flight Plans Committee, Norman Augustine, will be available for a news media conference on Wednesday, June 17, from approximately 5 to 5:30 p.m. EDT.

The media availability will be in the Carnegie Institute, 1530 P Street NW, Washington, 20005. No prior registration is necessary.

Since retiring from his role as chairman and CEO of Lockheed Martin more than a decade ago, Augustine has been one of the nation's leading voices for renewed focus on strengthening American science and technology education. He has chaired several distinguished blue ribbon panels, including the one resulting in the important "Rising Above the Gathering Storm" report of the National Academies and the earlier "Augustine Commission" report on the future of the U.S. space program.

NASA Television will carry the availability live on the agency's media channel. For NASA TV information, visit:

http://www.nasa.gov/ntv

For information about the committee's charter, schedules, meeting agendas and member biographies, visit:

http://hsf.nasa.gov

For information about NASA, visit:

http://www.nasa.gov

Tuesday, June 16, 2009

Planck Chills Out

0 comments
PlanckA JPL-developed and -built cooler on the Planck spacecraft has chilled the mission's low-frequency instrument down to its operating temperature of a frosty 20 Kelvin (minus 424 degrees Fahrenheit). The so-called hydrogen sorption cooler was turned on June 4 and achieved the target temperature of 20 Kelvin eight days later. The cooler is part of a chain of coolers that works together to ultimately chill the high-frequency instrument down to 0.1 Kelvin -- an event scheduled to take place in a few weeks.

Planck is currently on its way to its final orbit at the second Lagrange point, which is located about 1.5 million kilometers (930,000 miles) from Earth, on the opposite side of our planet from the sun. Once there, it will look back to the dawn of time to study the birth of our universe.

Monday, June 15, 2009

Transportation on the Moon

0 comments
Transportation on the MoonUnlike Earth the moon does not have air, food and water, so it would take a lot of effort for humans to live and work there, wrote Raina Huang, a student at Bexley High School in Columbus, Ohio, and finalist in the second annual NASA Lunar Art Contest.

The contest, sponsored by NASA's Langley Research Center, had a total of 147 entrants from 25 states, France, Poland, India and Romania. A panel of 12 reviewers that included professional artists, scientists, engineers and educators evaluated the entries using three criteria: the artist's statement, creativity and artistic expression, and whether the art represented a valid scenario.

To view the 2009 contest winners, visit NASA Lunar Art Contest.