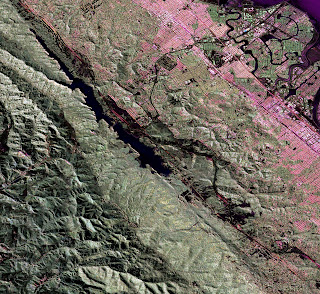
 NASA Gives California's San Andreas, Other Faults a 3-D Close-up
Story Highlights
• New
NASA 3-D airborne radar to study California's earthquake faults.
• Radar sees below the surface to measure buildup and release of strain along faults.
• Data can be used to guide rescue and damage assessment efforts after a quake.
• LA basin, San Francisco Bay among areas to be studied.
When a swarm of hundreds of small to moderate earthquakes erupted beneath California's Salton Sea in March, sending spasms rumbling across the desert floor, it set off more than just seismometers. It also raised the eyebrows of quite a few concerned scientists. The reason: lurking underground, just a few kilometers to the northeast, lays a sleeping giant: the 160-kilometer-(100-mile) long southern segment of the notorious 1,300-kilometer- (800-mile) long San Andreas fault. Scientists were concerned that the recent earthquake swarm at the Salton Sea's Bombay Beach could perhaps be the straw that broke the camel's back, triggering "the big one," a huge earthquake that could devastate Southern California.
The southern end of the San Andreas has remained silent, at least for now. But the earthquake swarm and more recent, widely felt earthquakes in the Los Angeles area have stirred renewed interest in earthquake research. A multi-year project currently under way at
NASA's Jet Propulsion Laboratory, Pasadena, Calif., is seeking to improve our understanding of these mysterious and sometimes deadly natural hazards by using a groundbreaking, JPL-developed airborne radar to study earthquake processes along the San Andreas and other California faults.
The 'Mother of California Faults'Formed 15 to 20 million years ago, the San Andreas has defined California's seismic history and dramatically altered its landscape. It serves as the boundary between the two massive tectonic plates upon which the Golden State rides: the Pacific and North American plates.
Grinding horizontally past each other in a roughly north-south direction at up to 3.5 centimeters (1.4 inches) a year, the fault is a battle zone of pulverized rock, extending to depths of at least 16 kilometers (10 miles). In some places, the plates "creep" quietly past each other, producing small to moderate earthquakes, in a process known as aseismic creep.
But other parts of the fault get "stuck." They lock in place for sometimes hundreds of years before eventually releasing their pent-up frustrations in epic lunges, such as those responsible for the large magnitude 7.9 earthquakes that struck a then sparsely populated Southern California near Fort Tejon in 1857, and San Francisco in 1906.
From San Luis Obispo south to the Cajon Pass near San Bernardino, the San Andreas forms a largely unbroken line that is often clearly visible from the ground and air. South of Cajon Pass, however, the fault zone becomes more complex. Here, several different faults share the "burden" of moving the tectonic plates, including the San Andreas and the parallel and intersecting San Jacinto and southern San Andreas faults, among others. North of San Luis Obispo, the fault zone similarly splits into nearly parallel faults, with the Hayward and Calaveras faults sharing the plate motion with the San Andreas in the San Francisco Bay area.
Paleoseismological studies dating back 1,500 years have shown that large earthquakes occur on the southern San Andreas about every 250 to 300 years, on average. Yet the extreme southern segment of the fault hasn't budged for about 320 years. It is apparently overdue, primed for another large event.
Last year, the United States Geological Survey estimated that such a large earthquake, originating near the Salton Sea and rupturing the ground northward to near Lake Hughes in Los Angeles County, could devastate an eight-county region, killing up to 1,800, injuring 50,000, displacing a quarter million people, significantly damaging 300,000 buildings and causing an estimated $213 billion in damage.
Searching for Clues From Above and BelowLike doctors assessing the health of a patient, scientists use a broad array of tools to "listen" to the San Andreas and other faults, looking for clues about their past, present and future behavior. They dig trenches across faults, and place instruments, such as seismographs, creep meters and stress meters, into the ground to try to detect any changes that might be occurring above or below Earth's surface.
Increasingly, they also rely on space-based technologies, such as those being developed at JPL. Space-based instruments can image minute
Earth movements to within a few centimeters (fractions of an inch), measuring the slow buildup of deformation along faults and mapping ground deformation after
earthquakes occur. Among these tools are the Global Positioning System and interferometric synthetic aperture radar, or
InSAR.
Until recently, the only
InSAR data available for the San Andreas and other California faults have come from
European Space Agency, Canadian and Japanese radar satellites. But those satellites aren't dedicated to or optimized for studying earthquakes, and the availability of their data is limited.
A New 3-D Radar ToolNow,
JPL scientists have added a new airborne radar tool to their arsenal. Called the Uninhabited Aerial Vehicle Synthetic Aperture Radar, or
UAVSAR, this L-band wavelength radar flies aboard a modified
NASA Gulfstream III aircraft from
NASA's Dryden Flight Research Center, Edwards, Calif. The compact, reconfigurable radar, housed in a pod under the aircraft's fuselage, uses pulses of microwave energy to detect and measure very subtle deformations in Earth's surface, such as those caused by earthquakes, volcanoes, landslides and glacier movements.
UAVSAR works like this: flying at a nominal altitude of 13,800 meters (45,000 feet), the radar collects data over a selected region. It then flies over the same region again, minutes to months later, using the aircraft's advanced navigation system to precisely fly over the same path to an accuracy of within 4.6 meters (15 feet). By comparing these camera-like images, called interferograms, over time, scientists can measure the slow surface deformations involved with the buildup and release of strain along earthquake faults.
(
UAVSAR is currently wrapping up a two-month expedition in Greenland and Iceland to study the flow of glaciers and ice streams. See
http://www.jpl.nasa.gov/news/news.cfm?release=2009-075 and
http://www.jpl.nasa.gov/news/features.cfm?feature=2156 ).
'Mowing the Lawn'Last November,
JPL scientists began conducting a series of
UAVSAR flights over regions of Northern and Southern California that are actively deforming and are marked by frequent earthquakes. About every six months for the next several years, the scientists will precisely repeat the same flight paths to produce interferograms. From these data, 3-D maps will be created for regions of interest, including the mighty San Andreas and other California faults, extending from the Mexican border to Santa Rosa in the northern San Francisco Bay. Last month, the scientists completed their first full map of the San Andreas. Some regions, such as Parkfield on the central San Andreas, and the Hayward fault, have already had more than one flyover.
"We'll be 'mowing the lawn,' so to speak, mapping the San Andreas and adjacent faults, segment by segment, and then periodically repeating the same radar observations," said Andrea Donnellan, one of three JPL principal investigators on the
UAVSAR fault mapping project, and program area lead for Natural Disasters in
NASA Headquarters' Science Mission Directorate, Washington.
"By comparing these repeat-pass radar observations, we hope to measure any crustal deformations that may occur between observations, allowing us to 'see' the amount of strain building up in the San Andreas and adjoining faults,” Donnellan said. “This will give us a much clearer picture of which faults are active and at what rates they're moving, both before earthquakes and after them."
Donnellan said the UAVSAR fault mapping data will substantially improve our knowledge of regional earthquake hazards in California. "The 3-D UAVSAR data will allow scientists to bring entire faults into focus, allowing them to see the faults not just at their surfaces, but also at depth," she said. "When integrated into computer models, the data should give scientists a much clearer picture of California's complex fault systems, such as those in the Los Angeles basin and in the area around the Salton Sea."
The scientists will estimate the total displacement occurring in each region. As more observations are collected, they expect to be able to determine how strain is partitioned between individual faults. They'll also be able to measure ground signals caused by human activities, such as pumping water into or out of the ground or drilling for oil.
The
UAVSAR flights will serve as a baseline for pre-earthquake activity. Should earthquakes occur during the course of this project, the team will measure the deformation at the time of the earthquakes to determine the distribution of slip on the faults, and then monitor longer-term motions after the earthquakes to learn more about fault zone properties.
"Airborne UAVSAR mapping can allow a rapid response after an earthquake to determine what fault was the source and which parts of the fault slipped during the earthquake," said Eric Fielding, another JPL principal investigator on the UAVSAR project. "Information about the earthquake source can be used to estimate what areas were most affected by the earthquake shaking to guide rescue and damage assessment response."
The
UAVSAR data will also be used to test the earthquake forecasting methodology developed by UC Davis scientist John Rundle under
NASA's QuakeSim project (see
http://www.jpl.nasa.gov/news/news.cfm?release=2003/-074 ). The experiment identifies regions that have a high probability for earthquakes in the near future.
Mapping Faults from the Salton Sea to Santa RosaDonnellan's research will focus on Southern California between the Salton Sea and the Pacific coast, along with the Los Angeles basin, the seismically active Transverse Ranges (the east-west-oriented mountain ranges located between San Diego and Santa Barbara), and the San Francisco Bay area up through Santa Rosa.
Meanwhile, JPL colleagues Paul Lundgren and Zhen Liu will focus on the central San Andreas fault between the Bay Area and Los Angeles. This area is a transition zone between the creeping part of the fault north of the Parkfield segment, which has experienced fairly regular moderate earthquakes of around magnitude 6, and the Carrizo Plain segment, which ruptured in the 1857 Fort Tejon earthquake. They will also integrate
UAVSAR with
GPS and satellite
InSAR data to form more complete models of how the fault slips over time.
JPL's Eric Fielding will focus on the Hayward fault along the east side of San Francisco Bay, identified as having the highest risk of a damaging earthquake in the Bay Area. The Hayward fault creeps in some parts, but also ruptured in a magnitude 6.8 to 7.0 earthquake in 1868 that caused extensive damage due to its location in the heart of the Bay Area. Fielding will analyze this creep to determine how much of the fault's overall motion is being released gradually, without large earthquakes, and estimate how much of the fault has accumulated stress since the 1868 quake that could rupture again. From these data, Fielding's team hopes to develop models of how stress and strain is evolving on the fault system and infer properties of the fault zone.
"Previous studies of the Hayward fault using satellite InSAR were limited by fixed satellite orbits and shorter radar wavelengths that only provided useful measurements in the urbanized areas of the San Francisco Bay," said Fielding. "
UAVSAR will give us a complete picture of the 3-D deformation and map much finer details than are possible from space."
Initial science results from the UAVSAR fault mapping project will be available some time after the second round of mapping flights are completed. In the meantime, the science team is busy constructing computer models to compare with the actual UAVSAR data once they become available.
What's Next?Donnellan said
UAVSAR is also serving as a flying testbed to evaluate the tools and technologies for future space-based radars, such as those planned for a NASA mission currently in formulation called the Deformation, Ecosystem Structure and Dynamics of Ice, or DESDynI. That mission, which will study hazards such as earthquakes, volcanoes and landslides, as well as global environmental change, will use both a light detection and ranging sensor, or lidar, and an L-band radar that is very similar to
UAVSAR's but with a much wider ground swath. DESDynI will be capable of providing repeat-pass interferometric data every eight days.
Once DESDynI is in orbit,
UAVSAR will be used to calibrate its data and will complement its measurements by filling in gaps in its coverage.
"The Earth science community is anxiously awaiting the launch of
DESDynI in a few years," Donnellan said. "In the meantime,
UAVSAR data will give us a head start on better understanding California's complex fault systems. Its data will also help state and local governments mitigate losses from future earthquakes, including the inevitable 'big one' we all know is in our future."
To learn more about
UAVSAR, visit:
http://uavsar.jpl.nasa.gov .
To learn more about other ongoing
JPL earthquake research programs, visit:
http://quakesim.jpl.nasa.gov/ . Results of an earlier
InSAR study of deformation in the San Francisco Bay Area by Fielding are available at
http://www-radar.jpl.nasa.gov/CrustalDef/san_fran/index.html .
 The Herschel Space Observatory has snapped its first picture since blasting into space on May 14, 2009. The mission, led by the European Space Agency with important participation from NASA, will use infrared light to explore our cosmic roots, addressing questions of how stars and galaxies are born.
